Natural Product: NPC228343
| Natural Product ID | NPC228343 |
|
Common Name
The InCHIKey will be temporarily assigned as the "Common Name" if no IUPAC name or alternative short name is available.
| Nordihydroguaiaretic Acid |
| IUPAC Name | 4-[4-(3,4-dihydroxyphenyl)-2,3-dimethylbutyl]benzene-1,2-diol |
| Synonyms | Actinex; CHX-100; Masoprocol; MESO-NDGA; Meso-Nordihydroguaiaretic Acid; Nordihydroguaiaretic acid |
| Synthetic Gene Cluster | n.a. |
| ChEMBL Identifier | CHEMBL52 |
| PubChem CID |
4534 |
| Chemical Classification |
|
The Chemical Classification was calculated by Classyfire, a software for chemical taxonomy calculation. Reference: DOI:10.1186/s13321-016-0174-y.
 Chemical Representations
| Standard InCHIKey | HCZKYJDFEPMADG-UHFFFAOYSA-N |
| Standard InCHI | InChI=1S/C18H22O4/c1-11(7-13-3-5-15(19)17(21)9-13)12(2)8-14-4-6-16(20)18(22)10-14/h3-6,9-12,19-22H,7-8H2,1-2H3 |
| SMILES | CC(C(Cc1ccc(c(c1)O)O)C)Cc1ccc(c(c1)O)O |
 Calculated Properties
Physi-Chem Properties
| Molecular Weight: | 302.15 | Volume: | 322.113 Van der Waals volume.
|
| Dense: | 0.938 | LogP: | 3.627 The logarithm of the n-octanol/water distribution coefficients.
|
| logD7.4: | 3.642 The logarithm of the n-octanol/water distribution coefficient at pH=7.4.
|
LogS: | -3.678 The logarithm of aqueous solubility value.
|
| Rotatable Bonds: | 5.0 | Rigid Bonds: | 12.0 |
| TPSA: | 80.92 Topological Polar Surface Area.
|
H-Bond Acceptor: | 4.0 |
| H-Bond Donor: | 4.0 | Rings: | 2.0 |
| Heavy Atoms: | 4.0 |
MedChem Properties
| QED Drug-Likeness Score: | 0.637 | GASA: | 0.0 GASA represents the probability of being difficult to synthesize, ranging from 0 to 1.
|
| Synthetic Accessibility Score: | 3.027 | Fsp3: | 0.333 |
| MCE-18: | 28.0 MCE-18 stands for medicinal chemistry evolution.MCE-18≥45 is considered a suitable value.
|
Lipinski Rule-of-5: | Rejected |
| Pfizer Rule: | Rejected | GSK Rule: | Rejected |
| Golden Triangle Rule: | Rejected | BMS Rule: | 0 |
| Chelating Alert: | 1 | PAINS Alert: | 1 |
| Colloidal aggregators: | 0.914 | Fluc inhibitor: | 0.235 The fluc inhibitor value is the probability of being fLuc inhibitors, within the range of 0 to 1.
|
| Blue fluorescence: | 0.004 The blue fluorescence value is the probability of being blue fluorescence, within the range of 0 to 1
|
Green fluorescence: | 0.099 The green fluorescence value is the probability of being green fluorescence, within the range of 0 to 1
|
| Reactive compounds: | 0.685 | Promiscuous compounds: | 0.81 |
ADMET Properties (ADMETlab3.0)
ADMET: Absorption
| Caco-2 Permeability: | -5.085 | MDCK Permeability: | -4.787 |
| Pgp-inhibitor: | 0.002 | Pgp-substrate: | 0.007 |
| PAMPA: |
0.014 The experimental data for Peff was logarithmically transformed (logPeff). Molecules with log Peff values below 2.0 were classified as low-permeability (Category 0), while those with log Peff values exceeding 2.5 were classified as high-permeability (Category 1).
|
Human Intestinal Absorption (HIA): | 0.011 |
| 20% Bioavailability (F20%): | 0.987 | 30% Bioavailability (F30%): | 0.999 |
| 50% Bioavailability (F50%): | 1.0 |
ADMET: Distribution
| Blood-Brain-Barrier Penetration (BBB): | 0.054 | MRP1: | 0.943 |
| Plasma Protein Binding (PPB): | 85.503% | Volume Distribution (VD): | -0.226 |
| Fu: |
14.21% The fraction unbound in plasms.
|
OATP1B1 inhibitor: | 0.883 |
| OATP1B3 inhibitor: | 0.981 | BCRP inhibitor: | 0.923 |
| BSEP inhibitor: | 0.611 |
ADMET: Metabolism
| CYP1A2-inhibitor: | 0.0 | CYP1A2-substrate: | 0.006 |
| CYP2C19-inhibitor: | 1.0 | CYP2C19-substrate: | 0.999 |
| CYP2C9-inhibitor: | 0.605 | CYP2C9-substrate: | 0.919 |
| CYP2D6-inhibitor: | 0.766 | CYP2D6-substrate: | 0.999 |
| CYP3A4-inhibitor: | 0.995 | CYP3A4-substrate: | 1.0 |
| CYP2B6-substrate: | 0.0 | CYP2C8-inhibitor: | 1.0 |
| HLM stability: |
1.0 Human liver microsomal (HLM) stability. Category 0: stable+ (HLM > 30 min); Category 1: unstable- (HLM ≤ 30 min). The output value is the probability of human liver microsomal instability, where a value closer to 1 indicates a higher likelihood of instability.
|
ADMET: Excretion
| Clearance (CL): | 19.551 | Half-life (T1/2): | 1.898 |
ADMET: Toxicity
| hERG Blockers: | 0.459 | hERG Blockers (10um): | 0.965 |
| Human Hepatotoxicity (H-HT): | 0.503 | Drug-induced Liver Injury (DILI): | 0.083 |
| AMES Toxicity: | 0.166 | Rat Oral Acute Toxicity: | 0.088 |
| Maximum Recommended Daily Dose: | 0.532 | Skin Sensitization: | 0.997 |
| Carcinogencity: | 0.059 | Eye Corrosion: | 0.083 |
| Eye Irritation: | 0.952 | Respiratory Toxicity: | 0.145 |
| Drug-induced Neurotoxicity: | 0.014 | Ototoxicity: | 0.945 |
| Hematotoxicity: | 0.019 | Drug-induced Nephrotoxicity: | 0.008 |
| Genotoxicity: | 0.072 | RPMI-8226 Immunitoxicity: | 0.01 |
| A549 Cytotoxicity: | 0.98 | Hek293 Cytotoxicity: | 0.61 |
| BCF: |
1.739 Bioconcentration factors are used for considering secondary poisoning potential and assessing risks to human health via the food chain. The unit is -log10[(mg/L)/(1000*MW)].
|
IGC50: |
5.095 48 hour Tetrahymena pyriformis IGC50. The unit of IGC50 is -log10[(mg/L)/(1000*MW)].
|
| LC50DM: |
5.851 48 hour Daphnia magna LC50. The unit of LC50DM is -log10[(mg/L)/(1000*MW)].
|
LC50FM: |
5.587 96 hour fathead minnow LC50. The unit of LC50FM is -log10[(mg/L)/(1000*MW)].
|
 Species Source
| Organism ID | Organism Name | Taxonomy Level | Family | SuperKingdom | Isolation Part | Collection Location | Collection Time | Reference |
|---|---|---|---|---|---|---|---|---|
| NPO8187 | Schisandra chinensis | Species | Schisandraceae | Eukaryota | n.a. | n.a. | n.a. |
PMID[16562834] |
| NPO8187 | Schisandra chinensis | Species | Schisandraceae | Eukaryota | n.a. | fruit | n.a. |
PMID[24155209] |
| NPO8187 | Schisandra chinensis | Species | Schisandraceae | Eukaryota | n.a. | n.a. | n.a. |
PMID[24959987] |
| NPO8187 | Schisandra chinensis | Species | Schisandraceae | Eukaryota | n.a. | n.a. | n.a. |
PMID[25302569] |
| NPO17416 | Santolina oblongifolia | Species | Asteraceae | Eukaryota | n.a. | n.a. | n.a. |
PMID[8988605] |
| NPO8187 | Schisandra chinensis | Species | Schisandraceae | Eukaryota | n.a. | n.a. | n.a. | Database[COCONUT] |
| NPO17416 | Santolina oblongifolia | Species | Asteraceae | Eukaryota | n.a. | n.a. | n.a. | Database[COCONUT] |
| NPO8187 | Schisandra chinensis | Species | Schisandraceae | Eukaryota | n.a. | n.a. | n.a. | Database[HerDing] |
| NPO8187 | Schisandra chinensis | Species | Schisandraceae | Eukaryota | n.a. | n.a. | n.a. | Database[TCMID] |
| NPO8187 | Schisandra chinensis | Species | Schisandraceae | Eukaryota | n.a. | n.a. | n.a. | Database[TCM_Taiwan] |
| NPO8187 | Schisandra chinensis | Species | Schisandraceae | Eukaryota | n.a. | n.a. | n.a. | Database[TM-MC] |
| NPO17416 | Santolina oblongifolia | Species | Asteraceae | Eukaryota | n.a. | n.a. | n.a. | Database[UNPD] |
| NPO8187 | Schisandra chinensis | Species | Schisandraceae | Eukaryota | n.a. | n.a. | n.a. | Database[UNPD] |
Note for Reference:
In addition to directly collecting NP source organism data from primary literature (where reference will provided as NCBI PMID or DOI links), NPASS also integrated them from below databases:
☉ UNPD: Universal Natural Products Database [PMID: 23638153].
☉ StreptomeDB: a database of streptomycetes natural products [PMID: 33051671].
☉ TM-MC: a database of medicinal materials and chemical compounds in Northeast Asian traditional medicine [PMID: 26156871].
☉ TCM@Taiwan: a Traditional Chinese Medicine database [PMID: 21253603].
☉ TCMID: a Traditional Chinese Medicine database [PMID: 29106634].
☉ TCMSP: The traditional Chinese medicine systems pharmacology database and analysis platform [PMID: 24735618].
☉ HerDing: a herb recommendation system to treat diseases using genes and chemicals [PMID: 26980517].
☉ MetaboLights: a metabolomics database [PMID: 27010336].
☉ FooDB: a database of constituents, chemistry and biology of food species [www.foodb.ca].
 NP Quantity Composition/Concentration
| Organism ID | Organism Name | Organism Material Preparation | Organism Part | NP Quantity (Standard) | NP Quantity (Minimum) | NP Quantity (Maximum) | Quantity Unit | Reference |
|---|
Note for Reference:
In addition to directly collecting NP quantitative data from primary literature (where reference will provided as NCBI PMID or DOI links), NPASS also integrated NP quantitative records for specific NP domains (e.g., NPS from foods or herbs) from domain-specific databases. These databases include:
☉ DUKE: Dr. Duke's Phytochemical and Ethnobotanical Databases.
☉ PHENOL EXPLORER: is the first comprehensive database on polyphenol content in foods [PMID: 24103452], its homepage can be accessed at here.
☉ FooDB: a database of constituents, chemistry and biology of food species [www.foodb.ca].
 Biological Activity
Molecular-level activity
| Target ID | Target Type | Target Name | Target Organism | Activity Type | Activity Relation | Value | Unit | Reference |
|---|---|---|---|---|---|---|---|---|
| NPT153 | Individual protein | Androgen Receptor | Homo sapiens | Potency | n.a. | 38895.2 | nM | PubChem BioAssay data set |
| NPT152 | Individual protein | Nuclear factor erythroid 2-related factor 2 | Homo sapiens | Potency | n.a. | 30637.9 | nM | PubChem BioAssay data set |
| NPT162 | Individual protein | Heat shock protein beta-1 | Homo sapiens | Potency | n.a. | 24541.2 | nM | PubChem BioAssay data set |
| NPT106 | Individual protein | Peroxisome proliferator-activated receptor delta | Homo sapiens | Potency | n.a. | 21872.4 | nM | PubChem BioAssay data set |
| NPT163 | Individual protein | Nuclear factor NF-kappa-B p105 subunit | Homo sapiens | Potency | n.a. | 54941 | nM | PubChem BioAssay data set |
| NPT183 | Individual protein | Arachidonate 5-lipoxygenase | Rattus norvegicus | IC50 | = | 400.0 | nM | PMID[3820229] |
| NPT183 | Individual protein | Arachidonate 5-lipoxygenase | Rattus norvegicus | IC50 | = | 120.0 | nM | PMID[8568814] |
| NPT1119 | Individual protein | Arachidonate 12-lipoxygenase | Homo sapiens | IC50 | = | 5000.0 | nM | DOI[10.1016/0960-894X(95)00565-B] |
| NPT3068 | Individual protein | Leukotriene B4 receptor 1 | Homo sapiens | IC50 | = | 85.0 | nM | PMID[1313879] |
| NPT183 | Individual protein | Arachidonate 5-lipoxygenase | Rattus norvegicus | Inhibition | = | 60.0 | % | PMID[3806607] |
| NPT183 | Individual protein | Arachidonate 5-lipoxygenase | Rattus norvegicus | IC50 | = | 5000.0 | nM | PMID[1635053] |
| NPT183 | Individual protein | Arachidonate 5-lipoxygenase | Rattus norvegicus | IC50 | = | 410.0 | nM | PMID[11277534] |
| NPT183 | Individual protein | Arachidonate 5-lipoxygenase | Rattus norvegicus | Inhibition | = | 73.0 | % | PMID[11277534] |
| NPT183 | Individual protein | Arachidonate 5-lipoxygenase | Rattus norvegicus | IC50 | = | 150.0 | nM | PMID[2104936] |
| NPT1119 | Individual protein | Arachidonate 12-lipoxygenase | Homo sapiens | IC50 | = | 5100.0 | nM | PMID[12036375] |
| NPT183 | Individual protein | Arachidonate 5-lipoxygenase | Rattus norvegicus | IC50 | = | 100.0 | nM | PMID[8254620] |
| NPT183 | Individual protein | Arachidonate 5-lipoxygenase | Rattus norvegicus | IC50 | = | 10.0 | nM | DOI[10.1016/S0960-894X(01)80140-2] |
| NPT3021 | Individual protein | Arachidonate 5-lipoxygenase | Bos taurus | IC50 | = | 400.0 | nM | PMID[8258834] |
| NPT3021 | Individual protein | Arachidonate 5-lipoxygenase | Bos taurus | IC50 | = | 1000.0 | nM | PMID[8258834] |
| NPT183 | Individual protein | Arachidonate 5-lipoxygenase | Rattus norvegicus | IC50 | = | 500.0 | nM | PMID[2213827] |
| NPT183 | Individual protein | Arachidonate 5-lipoxygenase | Rattus norvegicus | IC50 | = | 300.0 | nM | PMID[2213827] |
| NPT183 | Individual protein | Arachidonate 5-lipoxygenase | Rattus norvegicus | IC50 | = | 140.0 | nM | PMID[3681891] |
| NPT257 | Individual protein | Arachidonate 15-lipoxygenase | Oryctolagus cuniculus | IC50 | = | 110.0 | nM | PMID[15713402] |
| NPT1438 | Individual protein | Insulin-like growth factor I receptor | Homo sapiens | IC50 | = | 900.0 | nM | PMID[17502145] |
| NPT1139 | Individual protein | Arachidonate 15-lipoxygenase, type II | Homo sapiens | IC50 | = | 11000.0 | nM | PMID[17869117] |
| NPT1119 | Individual protein | Arachidonate 12-lipoxygenase | Homo sapiens | IC50 | = | 2600.0 | nM | PMID[17869117] |
| NPT1665 | Individual protein | Cyclooxygenase-1 | Bos taurus | Inhibition | = | 31.0 | % | PMID[17976864] |
| NPT31 | Individual protein | Cyclooxygenase-2 | Homo sapiens | Inhibition | = | 10.0 | % | PMID[17976864] |
| NPT1665 | Individual protein | Cyclooxygenase-1 | Bos taurus | IC50 | = | 50000.0 | nM | PMID[19097798] |
| NPT31 | Individual protein | Cyclooxygenase-2 | Homo sapiens | IC50 | > | 50000.0 | nM | PMID[19097798] |
| NPT1119 | Individual protein | Arachidonate 12-lipoxygenase | Homo sapiens | IC50 | = | 180.0 | nM | PMID[12608855] |
| NPT1119 | Individual protein | Arachidonate 12-lipoxygenase | Homo sapiens | IC50 | = | 5900.0 | nM | PMID[19848434] |
| NPT149 | Individual protein | Endoplasmic reticulum-associated amyloid beta-peptide-binding protein | Homo sapiens | Potency | = | 7943.3 | nM | PubChem BioAssay data set |
| NPT211 | Individual protein | Hypoxia-inducible factor 1 alpha | Homo sapiens | Potency | = | 5011.9 | nM | PubChem BioAssay data set |
| NPT1119 | Individual protein | Arachidonate 12-lipoxygenase | Homo sapiens | Potency | = | 14125.4 | nM | PubChem BioAssay data set |
| NPT108 | Individual protein | Estrogen receptor alpha | Homo sapiens | IC50 | = | 22193.67 | nM | PubChem BioAssay data set |
| NPT282 | Individual protein | MAP kinase ERK2 | Homo sapiens | Potency | = | 39810.7 | nM | PubChem BioAssay data set |
| NPT151 | Individual protein | 15-hydroxyprostaglandin dehydrogenase [NAD+] | Homo sapiens | Potency | = | 12589.3 | nM | PubChem BioAssay data set |
| NPT151 | Individual protein | 15-hydroxyprostaglandin dehydrogenase [NAD+] | Homo sapiens | Potency | = | 14125.4 | nM | PubChem BioAssay data set |
| NPT109 | Individual protein | Cytochrome P450 3A4 | Homo sapiens | Potency | = | 12589.3 | nM | PubChem BioAssay data set |
| NPT2865 | Individual protein | Glucose-6-phosphate dehydrogenase-6-phosphogluconolactonase | Plasmodium berghei | IC50 | = | 29200.0 | nM | PubChem BioAssay data set |
| NPT1415 | Individual protein | Heat shock factor protein 1 | Mus musculus | EC50 | = | 2319.0 | nM | PubChem BioAssay data set |
| NPT1139 | Individual protein | Arachidonate 15-lipoxygenase, type II | Homo sapiens | Potency | n.a. | 1584.9 | nM | PubChem BioAssay data set |
| NPT1119 | Individual protein | Arachidonate 12-lipoxygenase | Homo sapiens | IC50 | = | 110.0 | nM | PMID[21739938] |
| NPT198 | Individual protein | Vitamin D receptor | Homo sapiens | Potency | n.a. | 44668.4 | nM | PubChem BioAssay data set |
| NPT135 | Individual protein | Chromobox protein homolog 1 | Homo sapiens | Potency | n.a. | 17782.8 | nM | PubChem BioAssay data set |
| NPT199 | Individual protein | DNA polymerase kappa | Homo sapiens | Potency | n.a. | 794.3 | nM | PubChem BioAssay data set |
| NPT199 | Individual protein | DNA polymerase kappa | Homo sapiens | Potency | n.a. | 10000.0 | nM | PubChem BioAssay data set |
| NPT199 | Individual protein | DNA polymerase kappa | Homo sapiens | Potency | n.a. | 22387.2 | nM | PubChem BioAssay data set |
| NPT199 | Individual protein | DNA polymerase kappa | Homo sapiens | Potency | n.a. | 891.3 | nM | PubChem BioAssay data set |
| NPT2865 | Individual protein | Glucose-6-phosphate dehydrogenase-6-phosphogluconolactonase | Plasmodium berghei | IC50 | = | 68400.0 | nM | PubChem BioAssay data set |
| NPT154 | Individual protein | Mothers against decapentaplegic homolog 3 | Homo sapiens | Potency | n.a. | 3162.3 | nM | PubChem BioAssay data set |
| NPT2865 | Individual protein | Glucose-6-phosphate dehydrogenase-6-phosphogluconolactonase | Plasmodium berghei | IC50 | = | 54900.0 | nM | PubChem BioAssay data set |
| NPT153 | Individual protein | Androgen Receptor | Homo sapiens | IC50 | = | 38800.0 | nM | PMID[22047606] |
| NPT153 | Individual protein | Androgen Receptor | Homo sapiens | IC50 | > | 10000.0 | nM | PMID[22047606] |
| NPT153 | Individual protein | Androgen Receptor | Homo sapiens | IC50 | > | 50000.0 | nM | PMID[22047606] |
| NPT10 | Individual protein | Geminin | Homo sapiens | Potency | n.a. | 6513.1 | nM | PubChem BioAssay data set |
| NPT1474 | Individual protein | ATP-dependent Clp protease proteolytic subunit | Bacillus subtilis (strain 168) | Potency | n.a. | 631.0 | nM | PubChem BioAssay data set |
| NPT100 | Individual protein | Glutaminase kidney isoform, mitochondrial | Homo sapiens | Potency | n.a. | 12589.3 | nM | PubChem BioAssay data set |
| NPT100 | Individual protein | Glutaminase kidney isoform, mitochondrial | Homo sapiens | Potency | n.a. | 5623.4 | nM | PubChem BioAssay data set |
| NPT10 | Individual protein | Geminin | Homo sapiens | Potency | n.a. | 366.3 | nM | PubChem BioAssay data set |
| NPT1853 | Individual protein | Putative uncharacterized protein | Trypanosoma brucei brucei (strain 927/4 GUTat10.1) | Potency | n.a. | 15848.9 | nM | PubChem BioAssay data set |
| NPT1853 | Individual protein | Putative uncharacterized protein | Trypanosoma brucei brucei (strain 927/4 GUTat10.1) | Potency | n.a. | 44668.4 | nM | PubChem BioAssay data set |
| NPT160 | Individual protein | TAR DNA-binding protein 43 | Homo sapiens | Potency | n.a. | 12589.3 | nM | PubChem BioAssay data set |
| NPT1139 | Individual protein | Arachidonate 15-lipoxygenase, type II | Homo sapiens | Activity | = | 10.0 | % | PMID[23669189] |
| NPT1119 | Individual protein | Arachidonate 12-lipoxygenase | Homo sapiens | Activity | = | 0.0 | % | PMID[23669189] |
| NPT1139 | Individual protein | Arachidonate 15-lipoxygenase, type II | Homo sapiens | Inhibition | = | 0.0 | % | PMID[23669189] |
| NPT1119 | Individual protein | Arachidonate 12-lipoxygenase | Homo sapiens | Inhibition | = | 0.0 | % | PMID[23669189] |
| NPT2620 | Individual protein | Seed linoleate 9S-lipoxygenase | Glycine max | IC50 | = | 400000.0 | nM | PMID[24495846] |
| NPT2620 | Individual protein | Seed linoleate 9S-lipoxygenase | Glycine max | Inhibition | = | 12.7 | % | PMID[24495846] |
| NPT11 | Individual protein | Guanine nucleotide-binding protein G(s), subunit alpha | Homo sapiens | Potency | n.a. | 50118.7 | nM | PubChem BioAssay data set |
| NPT1119 | Individual protein | Arachidonate 12-lipoxygenase | Homo sapiens | Activity | = | 1.5 | % | PMID[25036790] |
| NPT1588 | Individual protein | Estradiol 17-beta-dehydrogenase 2 | Homo sapiens | IC50 | = | 380.0 | nM | PMID[28319389] |
| NPT1587 | Individual protein | Estradiol 17-beta-dehydrogenase 1 | Homo sapiens | IC50 | = | 5500.0 | nM | PMID[28319389] |
| NPT346 | Individual protein | Transient receptor potential cation channel subfamily A member 1 | Homo sapiens | EC50 | = | 35481.34 | nM | PMID[30878828] |
| NPT346 | Individual protein | Transient receptor potential cation channel subfamily A member 1 | Homo sapiens | EC50 | = | 35000.0 | nM | PMID[30878828] |
| NPT346 | Individual protein | Transient receptor potential cation channel subfamily A member 1 | Homo sapiens | EC50 | = | 4900.0 | nM | PMID[30878828] |
| NPT1139 | Individual protein | Arachidonate 15-lipoxygenase, type II | Homo sapiens | IC50 | = | 13600.0 | nM | PMID[31774676] |
| NPT1139 | Individual protein | Arachidonate 15-lipoxygenase, type II | Homo sapiens | Activity | = | 31.4 | % | PMID[31774676] |
| NPT1109 | Individual protein | Apelin receptor | Homo sapiens | %Inhib (Mean) | = | 77.0 | % | GPCR results for EUbOPEN Chemogenomics Library 3 |
| NPT1109 | Individual protein | Apelin receptor | Homo sapiens | %Inhib (Mean) | = | 36.01 | % | GPCR results for EUbOPEN Chemogenomics Library 3 |
| NPT1627 | Individual protein | G-protein coupled receptor 35 | Homo sapiens | %Inhib (Mean) | = | 46.26 | % | GPCR results for EUbOPEN Chemogenomics Library 3 |
| NPT222 | Individual protein | Alpha-2a adrenergic receptor | Homo sapiens | %Inhib (Mean) | = | -11.1 | % | GPCR results for EUbOPEN Chemogenomics Library 3 |
| NPT222 | Individual protein | Alpha-2a adrenergic receptor | Homo sapiens | %Max (Mean) | = | 8.5 | % | GPCR results for EUbOPEN Chemogenomics Library 3 |
| NPT222 | Individual protein | Alpha-2a adrenergic receptor | Homo sapiens | %Inhib (Mean) | = | 57.67 | % | GPCR results for EUbOPEN Chemogenomics Library 3 |
| NPT226 | Individual protein | Beta-2 adrenergic receptor | Homo sapiens | %Max (Mean) | = | -0.99 | % | GPCR results for EUbOPEN Chemogenomics Library 3 |
| NPT226 | Individual protein | Beta-2 adrenergic receptor | Homo sapiens | %Inhib (Mean) | = | 18.19 | % | GPCR results for EUbOPEN Chemogenomics Library 3 |
| NPT1109 | Individual protein | Apelin receptor | Homo sapiens | %Inhib (Mean) | = | 61.78 | % | GPCR results for EUbOPEN Chemogenomics Library 3 |
| NPT101 | Individual protein | Glucagon-like peptide 1 receptor | Homo sapiens | %Inhib (Mean) | = | 13.77 | % | GPCR results for EUbOPEN Chemogenomics Library 3 |
| NPT222 | Individual protein | Alpha-2a adrenergic receptor | Homo sapiens | %Inhib (Mean) | = | 33.63 | % | GPCR results for EUbOPEN Chemogenomics Library 3 |
| NPT226 | Individual protein | Beta-2 adrenergic receptor | Homo sapiens | %Inhib (Mean) | = | 62.59 | % | GPCR results for EUbOPEN Chemogenomics Library 3 |
| NPT101 | Individual protein | Glucagon-like peptide 1 receptor | Homo sapiens | %Max (Mean) | = | 0.0 | % | GPCR results for EUbOPEN Chemogenomics Library 3 |
| NPT101 | Individual protein | Glucagon-like peptide 1 receptor | Homo sapiens | %Inhib (Mean) | = | 66.71 | % | GPCR results for EUbOPEN Chemogenomics Library 3 |
| NPT101 | Individual protein | Glucagon-like peptide 1 receptor | Homo sapiens | %Inhib (Mean) | = | 30.24 | % | GPCR results for EUbOPEN Chemogenomics Library 3 |
| NPT101 | Individual protein | Glucagon-like peptide 1 receptor | Homo sapiens | %Inhib (Mean) | = | 56.23 | % | GPCR results for EUbOPEN Chemogenomics Library 3 |
| NPT226 | Individual protein | Beta-2 adrenergic receptor | Homo sapiens | %Inhib (Mean) | = | 72.72 | % | GPCR results for EUbOPEN Chemogenomics Library 3 |
| NPT1109 | Individual protein | Apelin receptor | Homo sapiens | %Max (Mean) | = | -3.532 | % | GPCR results for EUbOPEN Chemogenomics Library 3 |
| NPT1109 | Individual protein | Apelin receptor | Homo sapiens | %Inhib (Mean) | = | 77.31 | % | GPCR results for EUbOPEN Chemogenomics Library 3 |
| NPT1627 | Individual protein | G-protein coupled receptor 35 | Homo sapiens | %Max (Mean) | = | -2.15 | % | GPCR results for EUbOPEN Chemogenomics Library 3 |
| NPT226 | Individual protein | Beta-2 adrenergic receptor | Homo sapiens | %Inhib (Mean) | = | 23.2 | % | GPCR results for EUbOPEN Chemogenomics Library 3 |
| NPT222 | Individual protein | Alpha-2a adrenergic receptor | Homo sapiens | %Inhib (Mean) | = | 17.54 | % | GPCR results for EUbOPEN Chemogenomics Library 3 |
| NPT1559 | Protein family | Cyclooxygenase | Rattus norvegicus | IC50 | = | 30000.0 | nM | PMID[1848292] |
| NPT1559 | Protein family | Cyclooxygenase | Rattus norvegicus | IC50 | > | 50000.0 | nM | PMID[2213827] |
| NPT50 | Individual protein | Tyrosyl-DNA phosphodiesterase 1 | Homo sapiens | Potency | = | 2818.4 | nM | PubChem BioAssay data set |
| NPT5320 | Individual protein | 14-3-3 protein gamma | Homo sapiens | IC50 | > | 50000.0 | nM | PubChem BioAssay data set |
| NPT55 | Individual protein | Putative fructose-1,6-bisphosphate aldolase | Giardia intestinalis | Potency | = | 22334.2 | nM | PubChem BioAssay data set |
| NPT797 | Individual protein | Cytoplasmic zinc-finger protein | Caenorhabditis elegans | EC50 | = | 26111.0 | nM | PubChem BioAssay data set |
| NPT533 | Protein-protein interaction | Runt-related transcription factor 1/Core-binding factor subunit beta | Homo sapiens | Potency | n.a. | 25118.9 | nM | PubChem BioAssay data set |
| NPT533 | Protein-protein interaction | Runt-related transcription factor 1/Core-binding factor subunit beta | Homo sapiens | Potency | n.a. | 39810.7 | nM | PubChem BioAssay data set |
| NPT905 | Individual protein | Glucose-6-phosphate 1-dehydrogenase | Homo sapiens | IC50 | > | 80000.0 | nM | PubChem BioAssay data set |
| NPT803 | Individual protein | Flap endonuclease 1 | Homo sapiens | Potency | n.a. | 44668.4 | nM | PubChem BioAssay data set |
| NPT803 | Individual protein | Flap endonuclease 1 | Homo sapiens | Potency | n.a. | 22387.2 | nM | PubChem BioAssay data set |
| NPT9 | Individual protein | DNA polymerase eta | Homo sapiens | Potency | n.a. | 28183.8 | nM | PubChem BioAssay data set |
| NPT29077 | Single protein | Psychosine receptor | Homo sapiens | IC50 | = | 2334.32 | nM | EUbOPEN Chemogenomics Library - GPCR Dose-Respose |
| NPT26694 | Single protein | Lipoxin A4 receptor | Homo sapiens | %Inhib (Mean) | = | 61.06 | % | GPCR results for EUbOPEN Chemogenomics Library 3 |
| NPT23767 | Single protein | G-protein coupled receptor 183 | Homo sapiens | IC50 | = | 3634.82 | nM | EUbOPEN Chemogenomics Library - GPCR Dose-Respose |
| NPT26694 | Single protein | Lipoxin A4 receptor | Homo sapiens | %Inhib (Mean) | = | 33.54 | % | GPCR results for EUbOPEN Chemogenomics Library 3 |
| NPT26694 | Single protein | Lipoxin A4 receptor | Homo sapiens | %Max (Mean) | = | -2.41 | % | GPCR results for EUbOPEN Chemogenomics Library 3 |
| NPT30125 | Single protein | C5a anaphylatoxin chemotactic receptor | Homo sapiens | %Inhib (Mean) | = | 24.62 | % | GPCR results for EUbOPEN Chemogenomics Library 3 |
| NPT26694 | Single protein | Lipoxin A4 receptor | Homo sapiens | %Inhib (Mean) | = | 35.08 | % | GPCR results for EUbOPEN Chemogenomics Library 3 |
| NPT30125 | Single protein | C5a anaphylatoxin chemotactic receptor | Homo sapiens | %Max (Mean) | = | -0.4841 | % | GPCR results for EUbOPEN Chemogenomics Library 3 |
| NPT30125 | Single protein | C5a anaphylatoxin chemotactic receptor | Homo sapiens | %Inhib (Mean) | = | 18.37 | % | GPCR results for EUbOPEN Chemogenomics Library 3 |
| NPT30125 | Single protein | C5a anaphylatoxin chemotactic receptor | Homo sapiens | %Inhib (Mean) | = | 63.75 | % | GPCR results for EUbOPEN Chemogenomics Library 3 |
| NPT30125 | Single protein | C5a anaphylatoxin chemotactic receptor | Homo sapiens | %Inhib (Mean) | = | 25.66 | % | GPCR results for EUbOPEN Chemogenomics Library 3 |
| NPT26694 | Single protein | Lipoxin A4 receptor | Homo sapiens | %Inhib (Mean) | = | 19.8 | % | GPCR results for EUbOPEN Chemogenomics Library 3 |
| NPT4747 | Protein family | Cyclooxygenase | Bos taurus | IC50 | = | 14000.0 | nM | PMID[2104936] |
| NPT89 | Individual protein | Seed lipoxygenase-1 | Glycine max | IC50 | = | 180.0 | nM | PMID[12036375] |
| NPT89 | Individual protein | Seed lipoxygenase-1 | Glycine max | IC50 | > | 10000.0 | nM | PMID[16143531] |
| NPT89 | Individual protein | Seed lipoxygenase-1 | Glycine max | IC50 | = | 3500.0 | nM | PMID[16509583] |
| NPT89 | Individual protein | Seed lipoxygenase-1 | Glycine max | Inhibition | = | 83.7 | % | PMID[17444626] |
| NPT89 | Individual protein | Seed lipoxygenase-1 | Glycine max | Inhibition | = | 94.7 | % | PMID[16190766] |
| NPT89 | Individual protein | Seed lipoxygenase-1 | Glycine max | IC50 | = | 1300.0 | nM | PMID[17126019] |
| NPT48 | Individual protein | Lysine-specific demethylase 4D-like | Homo sapiens | Potency | = | 22387.2 | nM | PubChem BioAssay data set |
| NPT48 | Individual protein | Lysine-specific demethylase 4D-like | Homo sapiens | Potency | = | 35481.3 | nM | PubChem BioAssay data set |
| NPT94 | Individual protein | Aldehyde dehydrogenase 1A1 | Homo sapiens | Potency | = | 10000.0 | nM | PubChem BioAssay data set |
| NPT94 | Individual protein | Aldehyde dehydrogenase 1A1 | Homo sapiens | Potency | = | 28183.8 | nM | PubChem BioAssay data set |
| NPT795 | Individual protein | Zinc finger protein mex-5 | Caenorhabditis elegans | EC50 | = | 8755.0 | nM | PubChem BioAssay data set |
| NPT7 | Individual protein | Thioredoxin reductase 1, cytoplasmic | Rattus norvegicus | Potency | n.a. | 22387.2 | nM | PubChem BioAssay data set |
| NPT7 | Individual protein | Thioredoxin reductase 1, cytoplasmic | Rattus norvegicus | Potency | n.a. | 19952.6 | nM | PubChem BioAssay data set |
| NPT444 | Individual protein | Ubiquitin carboxyl-terminal hydrolase 1 | Homo sapiens | Potency | n.a. | 10000.0 | nM | PubChem BioAssay data set |
| NPT3806 | Individual protein | Arachidonate 5-lipoxygenase | Mus musculus | IC50 | = | 400.0 | nM | PMID[21958738] |
| NPT89 | Individual protein | Seed lipoxygenase-1 | Glycine max | IC50 | = | 31300.0 | nM | PMID[22119153] |
| NPT484 | Individual protein | Luciferin 4-monooxygenase | Photinus pyralis | Potency | n.a. | 9074.3 | nM | PubChem BioAssay data set |
| NPT446 | Individual protein | Rap guanine nucleotide exchange factor 3 | Homo sapiens | Potency | n.a. | 50118.7 | nM | PubChem BioAssay data set |
| NPT77 | Individual protein | Transthyretin | Homo sapiens | EC50 | = | 8500.0 | nM | PMID[25314129] |
| NPT77 | Individual protein | Transthyretin | Homo sapiens | EC50 | = | 12600.0 | nM | PMID[25314129] |
| NPT77 | Individual protein | Transthyretin | Homo sapiens | Inhibition | < | 20.0 | % | PMID[25314129] |
| NPT77 | Individual protein | Transthyretin | Homo sapiens | EC50 | = | 7300.0 | nM | PMID[25314129] |
| NPT20556 | Single protein | Replicase polyprotein 1ab | Severe acute respiratory syndrome coronavirus 2 | Inhibition | = | 99.41 | % | DOI[10.6019/CHEMBL4495564] |
| NPT20556 | Single protein | Replicase polyprotein 1ab | Severe acute respiratory syndrome coronavirus 2 | Inhibition | = | 99.43 | % | DOI[10.6019/CHEMBL4495564] |
| NPT20556 | Single protein | Replicase polyprotein 1ab | Severe acute respiratory syndrome coronavirus 2 | IC50 | = | 2590.0 | nM | DOI[10.6019/CHEMBL4495564] |
| NPT4358 | Individual protein | Type-1 angiotensin II receptor | Homo sapiens | %Max (Mean) | = | 0.3162 | % | GPCR results for EUbOPEN Chemogenomics Library 3 |
| NPT23094 | Single protein | C-X3-C chemokine receptor 1 | Homo sapiens | %Inhib (Mean) | = | 60.09 | % | GPCR results for EUbOPEN Chemogenomics Library 3 |
| NPT29418 | Single protein | N-formyl peptide receptor 3 | Homo sapiens | IC50 | = | 3034.18 | nM | EUbOPEN Chemogenomics Library - GPCR Dose-Respose |
| NPT4358 | Individual protein | Type-1 angiotensin II receptor | Homo sapiens | %Inhib (Mean) | = | 38.16 | % | GPCR results for EUbOPEN Chemogenomics Library 3 |
| NPT692 | Individual protein | Histone deacetylase 6 | Homo sapiens | Inhibition | = | 12.85 | % | HDAC6 screening dataset using tau-based substrate in an enzymatic assay yields selective inhibitors and activators |
| NPT4358 | Individual protein | Type-1 angiotensin II receptor | Homo sapiens | %Inhib (Mean) | = | 41.13 | % | GPCR results for EUbOPEN Chemogenomics Library 3 |
| NPT4358 | Individual protein | Type-1 angiotensin II receptor | Homo sapiens | %Inhib (Mean) | = | 25.42 | % | GPCR results for EUbOPEN Chemogenomics Library 3 |
| NPT20556 | Single protein | Replicase polyprotein 1ab | Severe acute respiratory syndrome coronavirus 2 | IC50 relative | > | 20.0 | uM | ECBD screening data for assay EOS300044 |
| NPT23094 | Single protein | C-X3-C chemokine receptor 1 | Homo sapiens | %Inhib (Mean) | = | 19.0 | % | GPCR results for EUbOPEN Chemogenomics Library 3 |
| NPT692 | Individual protein | Histone deacetylase 6 | Homo sapiens | Inhibition | = | 1.0 | % | HDAC6 screening dataset using tau-based substrate in an enzymatic assay yields selective inhibitors and activators |
| NPT20556 | Single protein | Replicase polyprotein 1ab | Severe acute respiratory syndrome coronavirus 2 | IC50 relative | > | 20.0 | uM | ECBD screening data for assay EOS300041 |
| NPT23094 | Single protein | C-X3-C chemokine receptor 1 | Homo sapiens | %Max (Mean) | = | -1.914 | % | GPCR results for EUbOPEN Chemogenomics Library 3 |
| NPT4358 | Individual protein | Type-1 angiotensin II receptor | Homo sapiens | %Inhib (Mean) | = | 75.45 | % | GPCR results for EUbOPEN Chemogenomics Library 3 |
| NPT23094 | Single protein | C-X3-C chemokine receptor 1 | Homo sapiens | %Inhib (Mean) | = | 38.17 | % | GPCR results for EUbOPEN Chemogenomics Library 3 |
| NPT23094 | Single protein | C-X3-C chemokine receptor 1 | Homo sapiens | %Inhib (Mean) | = | 70.16 | % | GPCR results for EUbOPEN Chemogenomics Library 3 |
| NPT792 | Individual protein | Arachidonate 15-lipoxygenase | Homo sapiens | IC50 | = | 4900.0 | nM | DOI[10.1016/0960-894X(95)00565-B] |
| NPT792 | Individual protein | Arachidonate 15-lipoxygenase | Homo sapiens | IC50 | = | 110.0 | nM | PMID[24684213] |
| NPT5319 | Individual protein | 5-lipoxygenase | Solanum tuberosum | IC50 | > | 10000.0 | nM | PMID[16509583] |
| NPT792 | Individual protein | Arachidonate 15-lipoxygenase | Homo sapiens | IC50 | = | 3800.0 | nM | PMID[17502145] |
| NPT792 | Individual protein | Arachidonate 15-lipoxygenase | Homo sapiens | IC50 | = | 250.0 | nM | PMID[17869117] |
| NPT792 | Individual protein | Arachidonate 15-lipoxygenase | Homo sapiens | IC50 | = | 1100.0 | nM | PMID[19848434] |
| NPT51 | Individual protein | Microtubule-associated protein tau | Homo sapiens | Potency | = | 11220.2 | nM | PubChem BioAssay data set |
| NPT51 | Individual protein | Microtubule-associated protein tau | Homo sapiens | Potency | = | 15848.9 | nM | PubChem BioAssay data set |
| NPT51 | Individual protein | Microtubule-associated protein tau | Homo sapiens | Potency | = | 25118.9 | nM | PubChem BioAssay data set |
| NPT51 | Individual protein | Microtubule-associated protein tau | Homo sapiens | Potency | = | 17782.8 | nM | PubChem BioAssay data set |
| NPT792 | Individual protein | Arachidonate 15-lipoxygenase | Homo sapiens | Potency | = | 100.0 | nM | PubChem BioAssay data set |
| NPT4261 | Individual protein | Lipoxygenase | Glycine max | Activity | = | 83.7 | % | PMID[20888086] |
| NPT792 | Individual protein | Arachidonate 15-lipoxygenase | Homo sapiens | IC50 | = | 5100.0 | nM | PMID[21739938] |
| NPT8 | Individual protein | DNA polymerase iota | Homo sapiens | Potency | n.a. | 56234.1 | nM | PubChem BioAssay data set |
| NPT8 | Individual protein | DNA polymerase iota | Homo sapiens | Potency | n.a. | 44668.4 | nM | PubChem BioAssay data set |
| NPT445 | Individual protein | Peripheral myelin protein 22 | Rattus norvegicus | Potency | n.a. | 22370.3 | nM | PubChem BioAssay data set |
| NPT445 | Individual protein | Peripheral myelin protein 22 | Rattus norvegicus | Potency | n.a. | 8087.5 | nM | PubChem BioAssay data set |
| NPT4261 | Individual protein | Lipoxygenase | Glycine max | Inhibition | = | 40.0 | % | PMID[22126405] |
| NPT478 | Individual protein | Ataxin-2 | Homo sapiens | Potency | n.a. | 39810.7 | nM | PubChem BioAssay data set |
| NPT821 | Individual protein | Werner syndrome ATP-dependent helicase | Homo sapiens | Potency | n.a. | 17782.8 | nM | PubChem BioAssay data set |
| NPT755 | Individual protein | Peptidyl-prolyl cis-trans isomerase NIMA-interacting 1 | Homo sapiens | Potency | n.a. | 89125.1 | nM | PubChem BioAssay data set |
| NPT792 | Individual protein | Arachidonate 15-lipoxygenase | Homo sapiens | Activity | = | 0.0 | % | PMID[23669189] |
| NPT792 | Individual protein | Arachidonate 15-lipoxygenase | Homo sapiens | Inhibition | = | 0.0 | % | PMID[23669189] |
| NPT535 | Individual protein | Parathyroid hormone receptor | Homo sapiens | Potency | n.a. | 28183.8 | nM | PubChem BioAssay data set |
| NPT4261 | Individual protein | Lipoxygenase | Glycine max | IC50 | = | 51000.0 | nM | PMID[25456384] |
| NPT792 | Individual protein | Arachidonate 15-lipoxygenase | Homo sapiens | Activity | = | 23.1 | % | PMID[25036790] |
| NPT4261 | Individual protein | Lipoxygenase | Glycine max | IC50 | = | 9230.0 | nM | PMID[24938495] |
| NPT4261 | Individual protein | Lipoxygenase | Glycine max | Inhibition | = | 84.0 | % | PMID[25203780] |
| NPT4261 | Individual protein | Lipoxygenase | Glycine max | IC50 | = | 28000.0 | nM | PMID[25203780] |
| NPT4261 | Individual protein | Lipoxygenase | Glycine max | IC50 | = | 500.0 | nM | PMID[30715875] |
| NPT920 | Individual protein | Alpha-synuclein | Homo sapiens | IC50 | = | 210.0 | nM | PMID[30743095] |
| NPT920 | Individual protein | Alpha-synuclein | Homo sapiens | IC50 | = | 220.0 | nM | PMID[30743095] |
| NPT4003 | Individual protein | G-protein coupled receptor 120 | Homo sapiens | %Inhib (Mean) | = | 71.65 | % | GPCR results for EUbOPEN Chemogenomics Library 3 |
| NPT6035 | Individual protein | Sphingosine 1-phosphate receptor Edg-1 | Homo sapiens | %Inhib (Mean) | = | 24.4 | % | GPCR results for EUbOPEN Chemogenomics Library 3 |
| NPT4003 | Individual protein | G-protein coupled receptor 120 | Homo sapiens | %Max (Mean) | = | -0.5 | % | GPCR results for EUbOPEN Chemogenomics Library 3 |
| NPT6035 | Individual protein | Sphingosine 1-phosphate receptor Edg-1 | Homo sapiens | %Inhib (Mean) | = | 32.92 | % | GPCR results for EUbOPEN Chemogenomics Library 3 |
| NPT6197 | Individual protein | Glucose-dependent insulinotropic receptor | Homo sapiens | %Inhib (Mean) | = | 36.56 | % | GPCR results for EUbOPEN Chemogenomics Library 3 |
| NPT6197 | Individual protein | Glucose-dependent insulinotropic receptor | Homo sapiens | %Inhib (Mean) | = | 79.17 | % | GPCR results for EUbOPEN Chemogenomics Library 3 |
| NPT6035 | Individual protein | Sphingosine 1-phosphate receptor Edg-1 | Homo sapiens | %Max (Mean) | = | 7.191 | % | GPCR results for EUbOPEN Chemogenomics Library 3 |
| NPT6197 | Individual protein | Glucose-dependent insulinotropic receptor | Homo sapiens | %Inhib (Mean) | = | 7.39 | % | GPCR results for EUbOPEN Chemogenomics Library 3 |
| NPT6197 | Individual protein | Glucose-dependent insulinotropic receptor | Homo sapiens | IC50 | = | 3545.26 | nM | EUbOPEN Chemogenomics Library - GPCR Dose-Respose |
| NPT6035 | Individual protein | Sphingosine 1-phosphate receptor Edg-1 | Homo sapiens | %Inhib (Mean) | = | 14.54 | % | GPCR results for EUbOPEN Chemogenomics Library 3 |
| NPT792 | Individual protein | Arachidonate 15-lipoxygenase | Homo sapiens | IC50 | = | 1280.0 | nM | PMID[37182334] |
| NPT29660 | Single protein | Adhesion G-protein coupled receptor F1 | Homo sapiens | %Inhib (Mean) | = | 65.7 | % | GPCR results for EUbOPEN Chemogenomics Library 3 |
| NPT4003 | Individual protein | G-protein coupled receptor 120 | Homo sapiens | %Inhib (Mean) | = | 12.95 | % | GPCR results for EUbOPEN Chemogenomics Library 3 |
| NPT6197 | Individual protein | Glucose-dependent insulinotropic receptor | Homo sapiens | %Max (Mean) | = | -2.462 | % | GPCR results for EUbOPEN Chemogenomics Library 3 |
| NPT4003 | Individual protein | G-protein coupled receptor 120 | Homo sapiens | %Inhib (Mean) | = | 52.2 | % | GPCR results for EUbOPEN Chemogenomics Library 3 |
| NPT6197 | Individual protein | Glucose-dependent insulinotropic receptor | Homo sapiens | %Inhib (Mean) | = | 82.11 | % | GPCR results for EUbOPEN Chemogenomics Library 3 |
| NPT29660 | Single protein | Adhesion G-protein coupled receptor F1 | Homo sapiens | %Inhib (Mean) | = | 51.0 | % | GPCR results for EUbOPEN Chemogenomics Library 3 |
| NPT29660 | Single protein | Adhesion G-protein coupled receptor F1 | Homo sapiens | %Max (Mean) | = | -13.68 | % | GPCR results for EUbOPEN Chemogenomics Library 3 |
| NPT6035 | Individual protein | Sphingosine 1-phosphate receptor Edg-1 | Homo sapiens | %Inhib (Mean) | = | 64.16 | % | GPCR results for EUbOPEN Chemogenomics Library 3 |
| NPT29660 | Single protein | Adhesion G-protein coupled receptor F1 | Homo sapiens | %Inhib (Mean) | = | 49.92 | % | GPCR results for EUbOPEN Chemogenomics Library 3 |
| NPT4003 | Individual protein | G-protein coupled receptor 120 | Homo sapiens | %Inhib (Mean) | = | 7.5 | % | GPCR results for EUbOPEN Chemogenomics Library 3 |
| NPT29660 | Single protein | Adhesion G-protein coupled receptor F1 | Homo sapiens | %Inhib (Mean) | = | 95.59 | % | GPCR results for EUbOPEN Chemogenomics Library 3 |
| NPT74 | Individual protein | Proto-oncogene c-JUN | Homo sapiens | Potency | n.a. | 48966.2 | nM | PubChem BioAssay data set |
| NPT570 | Individual protein | Arachidonate 5-lipoxygenase | Homo sapiens | EC50 | > | 100.0 | mg kg-1 | PMID[1848292] |
| NPT570 | Individual protein | Arachidonate 5-lipoxygenase | Homo sapiens | IC50 | = | 160.0 | nM | PMID[2157009] |
| NPT570 | Individual protein | Arachidonate 5-lipoxygenase | Homo sapiens | IC50 | = | 85.0 | nM | PMID[2542553] |
| NPT570 | Individual protein | Arachidonate 5-lipoxygenase | Homo sapiens | IC50 | = | 130.0 | nM | PMID[17378609] |
| NPT570 | Individual protein | Arachidonate 5-lipoxygenase | Homo sapiens | IC50 | = | 500.0 | nM | PMID[9544564] |
| NPT570 | Individual protein | Arachidonate 5-lipoxygenase | Homo sapiens | IC50 | = | 380.0 | nM | PMID[18976930] |
| NPT570 | Individual protein | Arachidonate 5-lipoxygenase | Homo sapiens | Inhibition | = | 70.0 | % | PMID[15620243] |
| NPT570 | Individual protein | Arachidonate 5-lipoxygenase | Homo sapiens | IC50 | = | 35000.0 | nM | PMID[18541424] |
| NPT441 | Individual protein | Cytochrome P450 19A1 | Homo sapiens | IC50 | = | 11.0 | nM | PMID[20413308] |
| NPT570 | Individual protein | Arachidonate 5-lipoxygenase | Homo sapiens | IC50 | = | 110.0 | nM | PMID[19848434] |
| NPT570 | Individual protein | Arachidonate 5-lipoxygenase | Homo sapiens | IC50 | = | 1500.0 | nM | PMID[20667741] |
| NPT47 | Individual protein | ATP-dependent DNA helicase Q1 | Homo sapiens | Potency | = | 2238.7 | nM | PubChem BioAssay data set |
| NPT47 | Individual protein | ATP-dependent DNA helicase Q1 | Homo sapiens | Potency | = | 2818.4 | nM | PubChem BioAssay data set |
| NPT2264 | Protein family | Heat shock protein HSP90 | Homo sapiens | IC50 | = | 2623.2 | nM | PubChem BioAssay data set |
| NPT2264 | Protein family | Heat shock protein HSP90 | Homo sapiens | IC50 | > | 30000.0 | nM | PubChem BioAssay data set |
| NPT53 | Individual protein | 4'-phosphopantetheinyl transferase ffp | Bacillus subtilis | Potency | = | 79432.8 | nM | PubChem BioAssay data set |
| NPT53 | Individual protein | 4'-phosphopantetheinyl transferase ffp | Bacillus subtilis | Potency | = | 39810.7 | nM | PubChem BioAssay data set |
| NPT197 | Protein-protein interaction | Menin/Histone-lysine N-methyltransferase MLL | Homo sapiens | Potency | = | 39810.7 | nM | PubChem BioAssay data set |
| NPT539 | Individual protein | Cellular tumor antigen p53 | Homo sapiens | Potency | = | 31622.8 | nM | PubChem BioAssay data set |
| NPT47 | Individual protein | ATP-dependent DNA helicase Q1 | Homo sapiens | Potency | = | 44668.4 | nM | PubChem BioAssay data set |
| NPT532 | Individual protein | Lysine-specific demethylase 4A | Homo sapiens | Potency | n.a. | 22387.2 | nM | PubChem BioAssay data set |
| NPT4 | Individual protein | Large T antigen | Simian virus 40 | IC50 | n.a. | 21860.0 | nM | PubChem BioAssay data set |
| NPT570 | Individual protein | Arachidonate 5-lipoxygenase | Homo sapiens | IC50 | = | 25.0 | nM | PMID[21958737] |
| NPT570 | Individual protein | Arachidonate 5-lipoxygenase | Homo sapiens | IC50 | = | 120.0 | nM | PMID[21958738] |
| NPT22750 | Single protein | Uncharacterized protein | Solanum lycopersicum | IC50 | = | 50000.0 | nM | DOI[10.1584/jpestics.G10-66] |
| NPT570 | Individual protein | Arachidonate 5-lipoxygenase | Homo sapiens | Inhibition | = | 0.0 | % | PMID[23669189] |
| NPT570 | Individual protein | Arachidonate 5-lipoxygenase | Homo sapiens | Inhibition | = | 56.6 | % | PMID[24368208] |
| NPT49 | Individual protein | DNA-(apurinic or apyrimidinic site) lyase | Homo sapiens | Potency | n.a. | 31622.8 | nM | PubChem BioAssay data set |
| NPT570 | Individual protein | Arachidonate 5-lipoxygenase | Homo sapiens | IC50 | = | 100.0 | nM | PMID[30025348] |
| NPT22753 | Single protein | Replicase polyprotein 1ab | Middle East respiratory syndrome-related coronavirus (isolate UnitedKingdom/H123990006/2012) (Betacoronavirus England 1) (Humancoronavirus EMC) | IC50 | > | 10000.0 | nM | DOI[10.6019/CHEMBL4495564] |
| NPT22753 | Single protein | Replicase polyprotein 1ab | Middle East respiratory syndrome-related coronavirus (isolate UnitedKingdom/H123990006/2012) (Betacoronavirus England 1) (Humancoronavirus EMC) | Inhibition | = | 0.0 | % | DOI[10.6019/CHEMBL4495564] |
| NPT570 | Individual protein | Arachidonate 5-lipoxygenase | Homo sapiens | IC50 | = | 97.0 | nM | PMID[32018096] |
| NPT570 | Individual protein | Arachidonate 5-lipoxygenase | Homo sapiens | IC50 | = | 12500.0 | nM | PMID[32485533] |
In vitro activity
| Target ID | Target Type | Target Name | Target Organism | Activity Type | Activity Relation | Value | Unit | Reference |
|---|---|---|---|---|---|---|---|---|
| NPT83 | Cell line | MCF7 | Homo sapiens | IC50 | = | 24600.0 | nM | PMID[17502145] |
| NPT1460 | Cell line | L929 | Mus musculus | EC50 | = | 28000.0 | nM | PMID[9287415] |
| NPT1460 | Cell line | L929 | Mus musculus | EC50 | = | 19000.0 | nM | PMID[9287415] |
| NPT116 | Cell line | HL-60 | Homo sapiens | IC50 | = | 2300.0 | nM | PMID[16562834] |
| NPT116 | Cell line | HL-60 | Homo sapiens | IC50 | = | 12200.0 | nM | PMID[16562834] |
| NPT1195 | Cell line | PMNL | n.a. | IC50 | = | 400.0 | nM | PMID[10395494] |
| NPT83 | Cell line | MCF7 | Homo sapiens | IC50 | = | 8500.0 | nM | PMID[19615898] |
| NPT139 | Cell line | HT-29 | Homo sapiens | IC50 | = | 51300.0 | nM | PMID[19615898] |
| NPT65 | Cell line | HepG2 | Homo sapiens | IC50 | = | 54100.0 | nM | PMID[19615898] |
| NPT1083 | Cell line | A-375 | Homo sapiens | IC50 | = | 54300.0 | nM | PMID[19615898] |
| NPT1083 | Cell line | A-375 | Homo sapiens | Inhibition | = | 72.0 | % | PMID[19615898] |
| NPT1083 | Cell line | A-375 | Homo sapiens | Inhibition | = | 74.0 | % | PMID[19615898] |
| NPT1083 | Cell line | A-375 | Homo sapiens | Inhibition | = | 75.0 | % | PMID[19615898] |
| NPT1083 | Cell line | A-375 | Homo sapiens | IC50 | = | 230000.0 | nM | PMID[19615898] |
| NPT165 | Cell line | HeLa | Homo sapiens | IC50 | = | 0.08 | ug.mL-1 | PMID[19942440] |
| NPT71 | Cell line | HEK293 | Homo sapiens | Potency | n.a. | 35338.3 | nM | PubChem BioAssay data set |
| NPT367 | Cell line | MDA-N | Homo sapiens | GI50 | n.a. | 10209.39 | nM | PubChem BioAssay data set |
| NPT370 | Cell line | NCI-H23 | Homo sapiens | GI50 | n.a. | 20090.93 | nM | PubChem BioAssay data set |
| NPT368 | Cell line | SN12C | Homo sapiens | GI50 | n.a. | 36728.23 | nM | PubChem BioAssay data set |
| NPT369 | Cell line | ACHN | Homo sapiens | GI50 | n.a. | 16143.59 | nM | PubChem BioAssay data set |
| NPT371 | Cell line | UO-31 | Homo sapiens | GI50 | n.a. | 9549.93 | nM | PubChem BioAssay data set |
| NPT372 | Cell line | HOP-92 | Homo sapiens | GI50 | n.a. | 3140.51 | nM | PubChem BioAssay data set |
| NPT116 | Cell line | HL-60 | Homo sapiens | GI50 | n.a. | 2992.26 | nM | PubChem BioAssay data set |
| NPT90 | Cell line | DU-145 | Homo sapiens | GI50 | n.a. | 18793.17 | nM | PubChem BioAssay data set |
| NPT374 | Cell line | SF-539 | Homo sapiens | GI50 | n.a. | 17538.81 | nM | PubChem BioAssay data set |
| NPT373 | Cell line | SK-MEL-5 | Homo sapiens | GI50 | n.a. | 16788.04 | nM | PubChem BioAssay data set |
| NPT375 | Cell line | Malme-3M | Homo sapiens | GI50 | n.a. | 15922.09 | nM | PubChem BioAssay data set |
| NPT111 | Cell line | K562 | Homo sapiens | GI50 | n.a. | 25351.29 | nM | PubChem BioAssay data set |
| NPT376 | Cell line | A498 | Homo sapiens | GI50 | n.a. | 36982.82 | nM | PubChem BioAssay data set |
| NPT377 | Cell line | OVCAR-3 | Homo sapiens | GI50 | n.a. | 13740.42 | nM | PubChem BioAssay data set |
| NPT379 | Cell line | HOP-62 | Homo sapiens | GI50 | n.a. | 17100.15 | nM | PubChem BioAssay data set |
| NPT112 | Cell line | MOLT-4 | Homo sapiens | GI50 | n.a. | 8222.43 | nM | PubChem BioAssay data set |
| NPT378 | Cell line | NCI/ADR-RES | Homo sapiens | GI50 | n.a. | 22750.97 | nM | PubChem BioAssay data set |
| NPT380 | Cell line | U-251 | Homo sapiens | GI50 | n.a. | 18749.95 | nM | PubChem BioAssay data set |
| NPT381 | Cell line | OVCAR-8 | Homo sapiens | GI50 | n.a. | 17418.07 | nM | PubChem BioAssay data set |
| NPT382 | Cell line | OVCAR-5 | Homo sapiens | GI50 | n.a. | 21232.44 | nM | PubChem BioAssay data set |
| NPT383 | Cell line | SNB-19 | Homo sapiens | GI50 | n.a. | 19453.6 | nM | PubChem BioAssay data set |
| NPT385 | Cell line | SR | Homo sapiens | GI50 | n.a. | 9794.9 | nM | PubChem BioAssay data set |
| NPT82 | Cell line | MDA-MB-231 | Homo sapiens | GI50 | n.a. | 39084.09 | nM | PubChem BioAssay data set |
| NPT384 | Cell line | TK-10 | Homo sapiens | GI50 | n.a. | 23604.78 | nM | PubChem BioAssay data set |
| NPT323 | Cell line | SW-620 | Homo sapiens | GI50 | n.a. | 18879.91 | nM | PubChem BioAssay data set |
| NPT455 | Cell line | NCI-H522 | Homo sapiens | GI50 | n.a. | 2027.68 | nM | PubChem BioAssay data set |
| NPT387 | Cell line | M14 | Homo sapiens | GI50 | n.a. | 16519.62 | nM | PubChem BioAssay data set |
| NPT386 | Cell line | KM12 | Homo sapiens | GI50 | n.a. | 17100.15 | nM | PubChem BioAssay data set |
| NPT388 | Cell line | NCI-H322M | Homo sapiens | GI50 | n.a. | 23823.19 | nM | PubChem BioAssay data set |
| NPT389 | Cell line | RPMI-8226 | Homo sapiens | GI50 | n.a. | 10069.32 | nM | PubChem BioAssay data set |
| NPT456 | Cell line | OVCAR-4 | Homo sapiens | GI50 | n.a. | 14421.15 | nM | PubChem BioAssay data set |
| NPT390 | Cell line | LOX IMVI | Homo sapiens | GI50 | n.a. | 17418.07 | nM | PubChem BioAssay data set |
| NPT457 | Cell line | BT-549 | Homo sapiens | GI50 | n.a. | 13899.53 | nM | PubChem BioAssay data set |
| NPT147 | Cell line | SK-MEL-2 | Homo sapiens | GI50 | n.a. | 18450.15 | nM | PubChem BioAssay data set |
| NPT81 | Cell line | A549 | Homo sapiens | GI50 | n.a. | 33036.95 | nM | PubChem BioAssay data set |
| NPT392 | Cell line | SNB-75 | Homo sapiens | GI50 | n.a. | 19815.27 | nM | PubChem BioAssay data set |
| NPT391 | Cell line | HCC 2998 | Homo sapiens | GI50 | n.a. | 19054.61 | nM | PubChem BioAssay data set |
| NPT148 | Cell line | HCT-15 | Homo sapiens | GI50 | n.a. | 38904.51 | nM | PubChem BioAssay data set |
| NPT393 | Cell line | HCT-116 | Homo sapiens | GI50 | n.a. | 17258.38 | nM | PubChem BioAssay data set |
| NPT395 | Cell line | SF-268 | Homo sapiens | GI50 | n.a. | 16292.96 | nM | PubChem BioAssay data set |
| NPT394 | Cell line | EKVX | Homo sapiens | GI50 | n.a. | 23442.29 | nM | PubChem BioAssay data set |
| NPT83 | Cell line | MCF7 | Homo sapiens | GI50 | n.a. | 20230.19 | nM | PubChem BioAssay data set |
| NPT306 | Cell line | PC-3 | Homo sapiens | GI50 | n.a. | 21877.62 | nM | PubChem BioAssay data set |
| NPT146 | Cell line | SK-OV-3 | Homo sapiens | GI50 | n.a. | 21478.3 | nM | PubChem BioAssay data set |
| NPT396 | Cell line | T47D | Homo sapiens | GI50 | n.a. | 18365.38 | nM | PubChem BioAssay data set |
| NPT398 | Cell line | UACC-62 | Homo sapiens | GI50 | n.a. | 15958.79 | nM | PubChem BioAssay data set |
| NPT397 | Cell line | NCI-H460 | Homo sapiens | GI50 | n.a. | 16749.43 | nM | PubChem BioAssay data set |
| NPT308 | Cell line | CAKI-1 | Homo sapiens | GI50 | n.a. | 11428.78 | nM | PubChem BioAssay data set |
| NPT400 | Cell line | MDA-MB-435 | Homo sapiens | GI50 | n.a. | 13489.63 | nM | PubChem BioAssay data set |
| NPT399 | Cell line | SF-295 | Homo sapiens | GI50 | n.a. | 22130.95 | nM | PubChem BioAssay data set |
| NPT458 | Cell line | IGROV-1 | Homo sapiens | GI50 | n.a. | 16865.53 | nM | PubChem BioAssay data set |
| NPT402 | Cell line | Hs-578T | Homo sapiens | GI50 | n.a. | 16865.53 | nM | PubChem BioAssay data set |
| NPT401 | Cell line | 786-0 | Homo sapiens | GI50 | n.a. | 17179.08 | nM | PubChem BioAssay data set |
| NPT404 | Cell line | CCRF-CEM | Homo sapiens | GI50 | n.a. | 4375.22 | nM | PubChem BioAssay data set |
| NPT403 | Cell line | UACC-257 | Homo sapiens | GI50 | n.a. | 18238.96 | nM | PubChem BioAssay data set |
| NPT405 | Cell line | NCI-H226 | Homo sapiens | GI50 | n.a. | 22490.55 | nM | PubChem BioAssay data set |
| NPT139 | Cell line | HT-29 | Homo sapiens | GI50 | n.a. | 22855.99 | nM | PubChem BioAssay data set |
| NPT170 | Cell line | SK-MEL-28 | Homo sapiens | GI50 | n.a. | 16218.1 | nM | PubChem BioAssay data set |
| NPT406 | Cell line | RXF 393 | Homo sapiens | GI50 | n.a. | 13583.13 | nM | PubChem BioAssay data set |
| NPT407 | Cell line | COLO 205 | Homo sapiens | GI50 | n.a. | 18663.8 | nM | PubChem BioAssay data set |
| NPT1396 | Cell line | NCI-H69 | Homo sapiens | IC50 | = | 4400.0 | nM | PMID[24080463] |
| NPT547 | Cell line | BGC-823 | Homo sapiens | IC50 | > | 60000.0 | nM | PMID[27829519] |
| NPT3140 | Cell line | MGC-803 | Homo sapiens | IC50 | = | 45800.0 | nM | PMID[27829519] |
| NPT515 | Cell line | SGC-7901 | Homo sapiens | IC50 | > | 60000.0 | nM | PMID[27829519] |
| NPT65 | Cell line | HepG2 | Homo sapiens | IC50 relative | = | 10300.0 | nM | ECBD screening data for assay EOS300108 |
| NPT984 | Cell line | Hepatocyte | n.a. | TC50 | > | 1.0 | 10'5nM | PMID[18212104] |
| NPT597 | Organism | Spinacia oleracea | Spinacia oleracea | Fresh weight | = | 20.5 | ng g-1 | PMID[15149639] |
| NPT597 | Organism | Spinacia oleracea | Spinacia oleracea | Fresh weight | = | 165.3 | ng g-1 | PMID[15149639] |
| NPT597 | Organism | Spinacia oleracea | Spinacia oleracea | Fresh weight | = | 128.5 | ng g-1 | PMID[15149639] |
| NPT6 | Organism | Plasmodium falciparum | Plasmodium falciparum | IC50 | = | 12589.25 | nM | PMID[19734910] |
| NPT6 | Organism | Plasmodium falciparum | Plasmodium falciparum | IC50 | = | 3981.07 | nM | PMID[19734910] |
| NPT6 | Organism | Plasmodium falciparum | Plasmodium falciparum | IC50 | = | 5011.87 | nM | PMID[19734910] |
| NPT6 | Organism | Plasmodium falciparum | Plasmodium falciparum | IC50 | = | 10000.0 | nM | PMID[19734910] |
| NPT6 | Organism | Plasmodium falciparum | Plasmodium falciparum | IC50 | = | 7943.28 | nM | PMID[19734910] |
| NPT6 | Organism | Plasmodium falciparum | Plasmodium falciparum | Potency | n.a. | 15101.4 | nM | PubChem BioAssay data set |
| NPT6 | Organism | Plasmodium falciparum | Plasmodium falciparum | Potency | n.a. | 19011.5 | nM | PubChem BioAssay data set |
| NPT22752 | Protein complex | Transcription factor AP1 | Homo sapiens | IC50 | = | 7.9 | nM | PMID[24831826] |
| NPT20555 | Organism | SARS-CoV-2 | Severe acute respiratory syndrome coronavirus 2 | Inhibition | = | 84.75 | % | DOI[10.21203/rs.3.rs-23951/v1] |
| NPT20555 | Organism | SARS-CoV-2 | Severe acute respiratory syndrome coronavirus 2 | Hit score | = | 0.1128 | n.a. | DOI[10.1101/2020.04.21.054387] |
| NPT20555 | Organism | SARS-CoV-2 | Severe acute respiratory syndrome coronavirus 2 | Inhibition | = | 0.18 | % | DOI[10.6019/CHEMBL4495565] |
| NPT20555 | Organism | SARS-CoV-2 | Severe acute respiratory syndrome coronavirus 2 | Inhibition | = | -0.07 | % | DOI[10.6019/CHEMBL4495565] |
| NPT20555 | Organism | SARS-CoV-2 | Severe acute respiratory syndrome coronavirus 2 | IC50 | > | 100000.0 | nM | DOI[10.6019/CHEMBL4651402] |
| NPT28438 | Unchecked | Unchecked | n.a. | IC50 | = | 1280.0 | nM | PMID[37182334] |
| NPT28438 | Unchecked | Unchecked | n.a. | IC50 | = | 8500.0 | nM | PMID[36325400] |
| NPT610 | Others | Molecular identity unknown | n.a. | Lipid peroxidation | = | 26.1 | % | PMID[16190766] |
| NPT20529 | Non-molecular | NON-PROTEIN TARGET | n.a. | Activity | = | 81.0 | % | PMID[19232783] |
| NPT20529 | Non-molecular | NON-PROTEIN TARGET | n.a. | Activity | = | 82.6 | % | PMID[17444626] |
| NPT20529 | Non-molecular | NON-PROTEIN TARGET | n.a. | Activity | = | 96.5 | % | PMID[17444626] |
| NPT20529 | Non-molecular | NON-PROTEIN TARGET | n.a. | Activity | = | 98.0 | % | PMID[19232783] |
| NPT20529 | Non-molecular | NON-PROTEIN TARGET | n.a. | IC50 | = | 29000.0 | nM | PMID[17976864] |
| NPT20529 | Non-molecular | NON-PROTEIN TARGET | n.a. | Inhibition | = | 78.68 | % | PMID[8988605] |
| NPT20529 | Non-molecular | NON-PROTEIN TARGET | n.a. | IC50 | = | 6000.0 | nM | PMID[8988605] |
| NPT20529 | Non-molecular | NON-PROTEIN TARGET | n.a. | Activity | = | 83.0 | % | PMID[19232783] |
| NPT20529 | Non-molecular | NON-PROTEIN TARGET | n.a. | Activity | = | 97.0 | % | PMID[19232783] |
| NPT1188 | Organism | Plasmodium yoelii yoelii | Plasmodium yoelii yoelii | IC50 | = | 30000.0 | nM | PMID[18212104] |
| NPT22224 | Cell line | Vero C1008 | Chlorocebus sabaeus | CC50 | n.a. | 37200.0 | nM | DOI[10.6019/CHEMBL4651402] |
| NPT22224 | Cell line | Vero C1008 | Chlorocebus sabaeus | pCC50 | n.a. | 4.43 | n.a. | DOI[10.6019/CHEMBL4651402] |
| NPT1 | Others | Radical scavenging activity | n.a. | Activity | = | 68.0 | % | PMID[21757348] |
| NPT1 | Others | Radical scavenging activity | n.a. | Activity | = | 72.0 | % | PMID[19811914] |
| NPT1 | Others | Radical scavenging activity | n.a. | Activity | = | 81.0 | % | PMID[26515039] |
| NPT1 | Others | Radical scavenging activity | n.a. | Activity | = | 82.6 | % | PMID[17942306] |
| NPT1 | Others | Radical scavenging activity | n.a. | IC50 | = | 12.0 | ug.mL-1 | PMID[9599286] |
| NPT1 | Others | Radical scavenging activity | n.a. | Activity | > | 100.0 | /M/s | PMID[10395494] |
| NPT1 | Others | Radical scavenging activity | n.a. | Activity | = | 83.0 | % | PMID[23567956] |
| NPT1 | Others | Radical scavenging activity | n.a. | Activity | = | 63.0 | % | PMID[19781823] |
| NPT1 | Others | Radical scavenging activity | n.a. | Activity | = | 65.0 | % | PMID[19781823] |
| NPT1 | Others | Radical scavenging activity | n.a. | Activity | = | 84.0 | % | PMID[20888086] |
| NPT1 | Others | Radical scavenging activity | n.a. | Activity | = | 93.0 | % | PMID[21049954] |
| NPT1 | Others | Radical scavenging activity | n.a. | Activity | = | 97.0 | % | PMID[20434240] |
| NPT1 | Others | Radical scavenging activity | n.a. | IC50 | = | 4200.0 | nM | PMID[20452101] |
| NPT1 | Others | Radical scavenging activity | n.a. | Activity | = | 96.0 | % | PMID[21049954] |
| NPT1 | Others | Radical scavenging activity | n.a. | Activity | = | 77.0 | % | PMID[24769352] |
| NPT1 | Others | Radical scavenging activity | n.a. | Activity | = | 91.0 | % | PMID[22405290] |
| NPT1 | Others | Radical scavenging activity | n.a. | Inhibition | = | 81.0 | % | DOI[10.1007/s00044-010-9309-2] |
| NPT1 | Others | Radical scavenging activity | n.a. | Inhibition | = | 83.0 | % | PMID[25456384] |
| NPT1 | Others | Radical scavenging activity | n.a. | Activity | = | 80.0 | % | PMID[22405290] |
| NPT1 | Others | Radical scavenging activity | n.a. | IC50 | = | 6200.0 | nM | PMID[23117172] |
| NPT1 | Others | Radical scavenging activity | n.a. | Inhibition | = | 97.0 | % | DOI[10.1007/s00044-010-9309-2] |
| NPT1 | Others | Radical scavenging activity | n.a. | Inhibition | = | 93.0 | % | DOI[10.1007/s00044-010-9309-2] |
| NPT19 | Organism | Escherichia coli | Escherichia coli | MIC | = | 512.0 | ug.mL-1 | PMID[38283226] |
| NPT2 | Others | Unspecified | n.a. | Potency | n.a. | 17.4 | nM | PubChem BioAssay data set |
| NPT2 | Others | Unspecified | n.a. | Potency | n.a. | 17228.9 | nM | PubChem BioAssay data set |
| NPT2 | Others | Unspecified | n.a. | Potency | n.a. | 68589.6 | nM | PubChem BioAssay data set |
| NPT2 | Others | Unspecified | n.a. | Potency | n.a. | 61644.8 | nM | PubChem BioAssay data set |
| NPT2 | Others | Unspecified | n.a. | Potency | n.a. | 61130.6 | nM | PubChem BioAssay data set |
| NPT2 | Others | Unspecified | n.a. | Potency | n.a. | 13685.4 | nM | PubChem BioAssay data set |
| NPT2 | Others | Unspecified | n.a. | Potency | n.a. | 27535.7 | nM | PubChem BioAssay data set |
| NPT2 | Others | Unspecified | n.a. | Potency | n.a. | 7695.9 | nM | PubChem BioAssay data set |
| NPT2 | Others | Unspecified | n.a. | Potency | n.a. | 54941 | nM | PubChem BioAssay data set |
| NPT2 | Others | Unspecified | n.a. | Potency | n.a. | 30637.9 | nM | PubChem BioAssay data set |
| NPT2 | Others | Unspecified | n.a. | Potency | n.a. | 38895.2 | nM | PubChem BioAssay data set |
| NPT2 | Others | Unspecified | n.a. | Potency | n.a. | 15355.3 | nM | PubChem BioAssay data set |
| NPT2 | Others | Unspecified | n.a. | Potency | n.a. | 43641.2 | nM | PubChem BioAssay data set |
| NPT2 | Others | Unspecified | n.a. | Potency | n.a. | 1933.1 | nM | PubChem BioAssay data set |
| NPT2 | Others | Unspecified | n.a. | Potency | n.a. | 685.9 | nM | PubChem BioAssay data set |
| NPT2 | Others | Unspecified | n.a. | Potency | n.a. | 48966.2 | nM | PubChem BioAssay data set |
| NPT2 | Others | Unspecified | n.a. | Potency | n.a. | 6859 | nM | PubChem BioAssay data set |
| NPT2 | Others | Unspecified | n.a. | IC50 | = | 210000.0 | nM | PMID[8254620] |
| NPT2 | Others | Unspecified | n.a. | IC50 | = | 183000.0 | nM | PMID[15149639] |
| NPT1889 | Subcellular | Liposome | n.a. | IC50 | = | 2000.0 | nM | PMID[8201600] |
| NPT2 | Others | Unspecified | n.a. | Activity | = | 81.0 | % | PMID[21106277] |
| NPT2 | Others | Unspecified | n.a. | Activity | = | 83.0 | % | PMID[21041094] |
| NPT2 | Others | Unspecified | n.a. | Ratio IC50 | = | 0.1 | n.a. | PMID[17869117] |
| NPT2 | Others | Unspecified | n.a. | Inhibition | = | -4.5 | % | PMID[17284452] |
| NPT2 | Others | Unspecified | n.a. | IC50 | = | 14470.0 | nM | PMID[17284452] |
| NPT2 | Others | Unspecified | n.a. | IC50 | = | 1000.0 | nM | PMID[19097798] |
| NPT2 | Others | Unspecified | n.a. | IC50 | = | 5100.0 | nM | PMID[12608855] |
| NPT2 | Others | Unspecified | n.a. | Ratio IC50 | = | 46.0 | n.a. | PMID[12608855] |
| NPT2 | Others | Unspecified | n.a. | Ratio IC50 | = | 28.0 | n.a. | PMID[12608855] |
| NPT2 | Others | Unspecified | n.a. | Ratio IC50 | = | 2.0 | n.a. | PMID[12608855] |
| NPT2 | Others | Unspecified | n.a. | IC50 | = | 2000.0 | nM | PMID[10395494] |
| NPT2 | Others | Unspecified | n.a. | Activity | = | 0.23 | umol | PMID[10395494] |
| NPT2 | Others | Unspecified | n.a. | Inhibition | = | 84.0 | % | PMID[24502897] |
| NPT2 | Others | Unspecified | n.a. | IC50 | = | 40000.0 | nM | PMID[19853459] |
| NPT2 | Others | Unspecified | n.a. | IC50 | = | 11000.0 | nM | PMID[19848434] |
| NPT2 | Others | Unspecified | n.a. | IC50 | = | 54000.0 | nM | PMID[19848434] |
| NPT2 | Others | Unspecified | n.a. | Inhibition | = | 40.0 | % | PMID[21146903] |
| NPT2 | Others | Unspecified | n.a. | IC50 | = | 13000.0 | nM | PMID[20727750] |
| NPT2 | Others | Unspecified | n.a. | Potency | = | 8912.5 | nM | PubChem BioAssay data set |
| NPT2 | Others | Unspecified | n.a. | IC50 | = | 22310.0 | nM | PubChem BioAssay data set |
| NPT2 | Others | Unspecified | n.a. | EC50 | > | 110000.0 | nM | PubChem BioAssay data set |
| NPT2 | Others | Unspecified | n.a. | EC50 | = | 9480.0 | nM | PubChem BioAssay data set |
| NPT2 | Others | Unspecified | n.a. | EC50 | = | 11180.0 | nM | PubChem BioAssay data set |
| NPT2 | Others | Unspecified | n.a. | Potency | = | 28183.8 | nM | PubChem BioAssay data set |
| NPT2 | Others | Unspecified | n.a. | IC50 | = | 28000.0 | nM | PMID[26515039] |
| NPT2 | Others | Unspecified | n.a. | IC50 | = | 515000.0 | nM | PMID[21106277] |
| NPT20596 | Phenotype | Hepatotoxicity | n.a. | Composite Activity - Active | = | 0.0 | n.a. | PMID[16472241] |
| NPT20596 | Phenotype | Hepatotoxicity | n.a. | Composite Activity - Marginal | = | 0.0 | n.a. | PMID[16472241] |
| NPT20596 | Phenotype | Hepatotoxicity | n.a. | Alkaline Phosphatase Increase - Index Value | = | 0.0 | n.a. | PMID[16472241] |
| NPT20596 | Phenotype | Hepatotoxicity | n.a. | Alkaline Phosphatase Increase - Number of Reports | < | 4.0 | n.a. | PMID[16472241] |
| NPT20596 | Phenotype | Hepatotoxicity | n.a. | SGOT Increase - Index Value | = | 0.0 | n.a. | PMID[16472241] |
| NPT20596 | Phenotype | Hepatotoxicity | n.a. | SGOT Increase - Number of Reports | < | 4.0 | n.a. | PMID[16472241] |
| NPT20596 | Phenotype | Hepatotoxicity | n.a. | SGPT Increase - Index Value | = | 0.0 | n.a. | PMID[16472241] |
| NPT20596 | Phenotype | Hepatotoxicity | n.a. | SGPT Increase - Number of Reports | < | 4.0 | n.a. | PMID[16472241] |
| NPT20596 | Phenotype | Hepatotoxicity | n.a. | LDH Increase - Number of Reports | < | 4.0 | n.a. | PMID[16472241] |
| NPT20596 | Phenotype | Hepatotoxicity | n.a. | GGT Increase - Index Value | = | 0.0 | n.a. | PMID[16472241] |
| NPT20596 | Phenotype | Hepatotoxicity | n.a. | GGT Increase - Number of Reports | < | 4.0 | n.a. | PMID[16472241] |
| NPT2 | Others | Unspecified | n.a. | AC50 | > | 420000.0 | nM | PubChem BioAssay data set |
| NPT2 | Others | Unspecified | n.a. | Potency | n.a. | 1995.3 | nM | PubChem BioAssay data set |
| NPT2 | Others | Unspecified | n.a. | Potency | n.a. | 1578.5 | nM | PubChem BioAssay data set |
| NPT2 | Others | Unspecified | n.a. | Potency | n.a. | 14125.4 | nM | PubChem BioAssay data set |
| NPT2 | Others | Unspecified | n.a. | IC50 | = | 9820.0 | nM | PMID[21958738] |
| NPT2 | Others | Unspecified | n.a. | Inhibition | = | 88.84 | % | PMID[21958738] |
| NPT2 | Others | Unspecified | n.a. | Inhibition | = | 64.0 | % | PMID[22858299] |
| NPT2 | Others | Unspecified | n.a. | Potency | n.a. | 44668.4 | nM | PubChem BioAssay data set |
| NPT2 | Others | Unspecified | n.a. | Potency | n.a. | 10000.0 | nM | PubChem BioAssay data set |
| NPT2 | Others | Unspecified | n.a. | IC50 | = | 427000.0 | nM | PMID[21726077] |
| NPT2 | Others | Unspecified | n.a. | IC50 | = | 9300.0 | nM | PMID[21726077] |
| NPT2 | Others | Unspecified | n.a. | IC50 | = | 32000.0 | nM | PMID[23219856] |
| NPT2 | Others | Unspecified | n.a. | Potency | n.a. | 29092.9 | nM | PubChem BioAssay data set |
| NPT2 | Others | Unspecified | n.a. | IC50 | = | 12400.0 | nM | PMID[23786711] |
| NPT2 | Others | Unspecified | n.a. | Potency | n.a. | 7079.5 | nM | PubChem BioAssay data set |
| NPT2 | Others | Unspecified | n.a. | IC50 | = | 1300.0 | nM | PMID[26494261] |
| NPT29139 | Protein complex | Glutamate NMDA receptor; GRIN1/GRIN2B | Homo sapiens | Activity | n.a. | n.a. | n.a. | PMID[38665828] |
| NPT20596 | Phenotype | Hepatotoxicity | n.a. | LDH Increase - Index Value | = | 0.0 | n.a. | PMID[16472241] |
In vivo activity
| Target ID | Target Type | Target Name | Target Organism | Activity Type | Activity Relation | Value | Unit | Reference |
|---|---|---|---|---|---|---|---|---|
| NPT32 | Organism | Mus musculus | Mus musculus | ED50 | = | 3.1 | mg ear-1 | PMID[8568814] |
| NPT32 | Organism | Mus musculus | Mus musculus | Inhibition | = | 25.0 | % | PMID[2104936] |
| NPT32 | Organism | Mus musculus | Mus musculus | ED50 | = | 0.1 | mg ear-1 | PMID[2213827] |
| NPT32 | Organism | Mus musculus | Mus musculus | ED50 | > | 100.0 | mg.kg-1 | PMID[2213827] |
| NPT32 | Organism | Mus musculus | Mus musculus | Activity | = | 50.0 | % | PMID[9392883] |
| NPT32 | Organism | Mus musculus | Mus musculus | ED50 | = | 75.0 | mg.kg-1 | PMID[19615898] |
| NPT32 | Organism | Mus musculus | Mus musculus | Inhibition | = | 33.0 | % | PMID[21167711] |
| NPT32 | Organism | Mus musculus | Mus musculus | ID50 | = | 0.54 | umol | PMID[21167711] |
| NPT32 | Organism | Mus musculus | Mus musculus | Inhibition | = | 19.0 | % | PMID[21167711] |
| NPT32 | Organism | Mus musculus | Mus musculus | Inhibition | = | 65.0 | % | PMID[21167711] |
| NPT605 | Organism | Homo sapiens | Homo sapiens | IC50 | = | 300.0 | nM | PMID[3118023] |
| NPT605 | Organism | Homo sapiens | Homo sapiens | IC50 | = | 8000.0 | nM | DOI[10.1016/S0960-894X(01)80140-2] |
| NPT29 | Organism | Rattus norvegicus | Rattus norvegicus | IC50 | = | 100.0 | nM | DOI[10.1016/S0960-894X(01)80140-2] |
| NPT29 | Organism | Rattus norvegicus | Rattus norvegicus | Inhibition | = | 70.0 | % | DOI[10.1016/S0960-894X(01)80140-2] |
| NPT29 | Organism | Rattus norvegicus | Rattus norvegicus | Inhibition | = | 64.0 | % | PMID[3681891] |
| NPT29 | Organism | Rattus norvegicus | Rattus norvegicus | Inhibition | = | 15.1 | % | PMID[20045320] |
| NPT29 | Organism | Rattus norvegicus | Rattus norvegicus | Inhibition | = | 45.8 | % | PMID[16509583] |
| NPT29 | Organism | Rattus norvegicus | Rattus norvegicus | Inhibition | = | 62.5 | % | PMID[16509583] |
| NPT29 | Organism | Rattus norvegicus | Rattus norvegicus | ED50 | = | 205.0 | mg.kg-1 | PMID[20045320] |
 Experimental ADME
| Experiment Model | Experiment Tissue | ADME Type | ADME Relation | ADME Value | ADME Unit | Reference |
|---|
 Experimental Toxicity
Quantitative toxicity
| Experiment Model | Experiment Organism | Toxicity Type | Toxicity Relation | Toxicity Value | Toxicity Unit | Reference |
|---|
Common Abbreviations:
LC: Lethal Concentration; LD: Lethal Dose; LT:Lethal Time; NOAEL: No-observed-adverse-effect Level; BMDL: Benchmark Dose Lower Confidence Limit; BMD: Benchmark Dose; BMC:Benchmark Concentration; LOAEL: Lowest Observed Adverse Effect Level; RfD:Reference Dose; RfC:Reference Concentration; MRL: Minimal Risk Level; MEG: Maximum Exposure Guideline; PAC: Protective Action Criteria
Categorical toxicity labels
| Hepatotoxicity | Carcinogenicity | Mutagenicity | Cardiotoxicity | Respiratory Toxicity | Eye Irritation | Endocrine Disruption |
|---|---|---|---|---|---|---|

|

|

|

|

|

|

|
Note for Reference:
In addition to directly collecting NP quantitative data from primary literature (where reference will provided as NCBI PMID or DOI links), NPASS also integrated NP toxicity records from domain-specific databases. These databases include:
☉ ToxValDB: a curated database that compiles quantitative toxicity values for chemicals from diverse public sources to support toxicological research and risk assessment.
☉ TOXRIC: a comprehensive, free-to-access, online database providing toxicological/feature data. The toxicity labels are retrieved from this database. [PMID: 36400569]
 Chemically structural similarity
Similar Active Natural Products in NPASS
Top-200 similar NPs were calculated against the active-NP-set (includes approximately 50,000 NPs with experimentally-derived bioactivity available in NPASS)
Similarity is measured using the Tanimoto coefficient (Tc) , which compares the binary fingerprints of two molecules. Tc is calculated as the intersection divided by the union of '1' bits in the fingerprints, ranging from 0 to 1, with 1 indicating highest similarity.
● The left chart: Distribution of similarity level between NPC228343 and all remaining natural products in the NPASS database.
● The right table: Most similar natural products (Tc>=0.5 or Top200).
| Similarity Score | Similarity Level | Natural Product ID |
|---|---|---|
| 1.0 | High Similarity | NPC565062 |
| 0.6486 | Remote Similarity | NPC56214 |
| 0.6071 | Remote Similarity | NPC109955 |
| 0.5667 | Remote Similarity | NPC146422 |
| 0.5667 | Remote Similarity | NPC12278 |
| 0.5152 | Remote Similarity | NPC110764 |
| 0.5152 | Remote Similarity | NPC268032 |
| 0.5135 | Remote Similarity | NPC605114 |
Similar Clinical/Approved Drugs
Similarity level is defined by Tanimoto coefficient (Tc) between two molecules.
● The left chart: Distribution of similarity level between NPC228343 and all drugs/candidates.
● The right table: Most similar clinical/approved drugs (Tc>=0.5 or Top200).
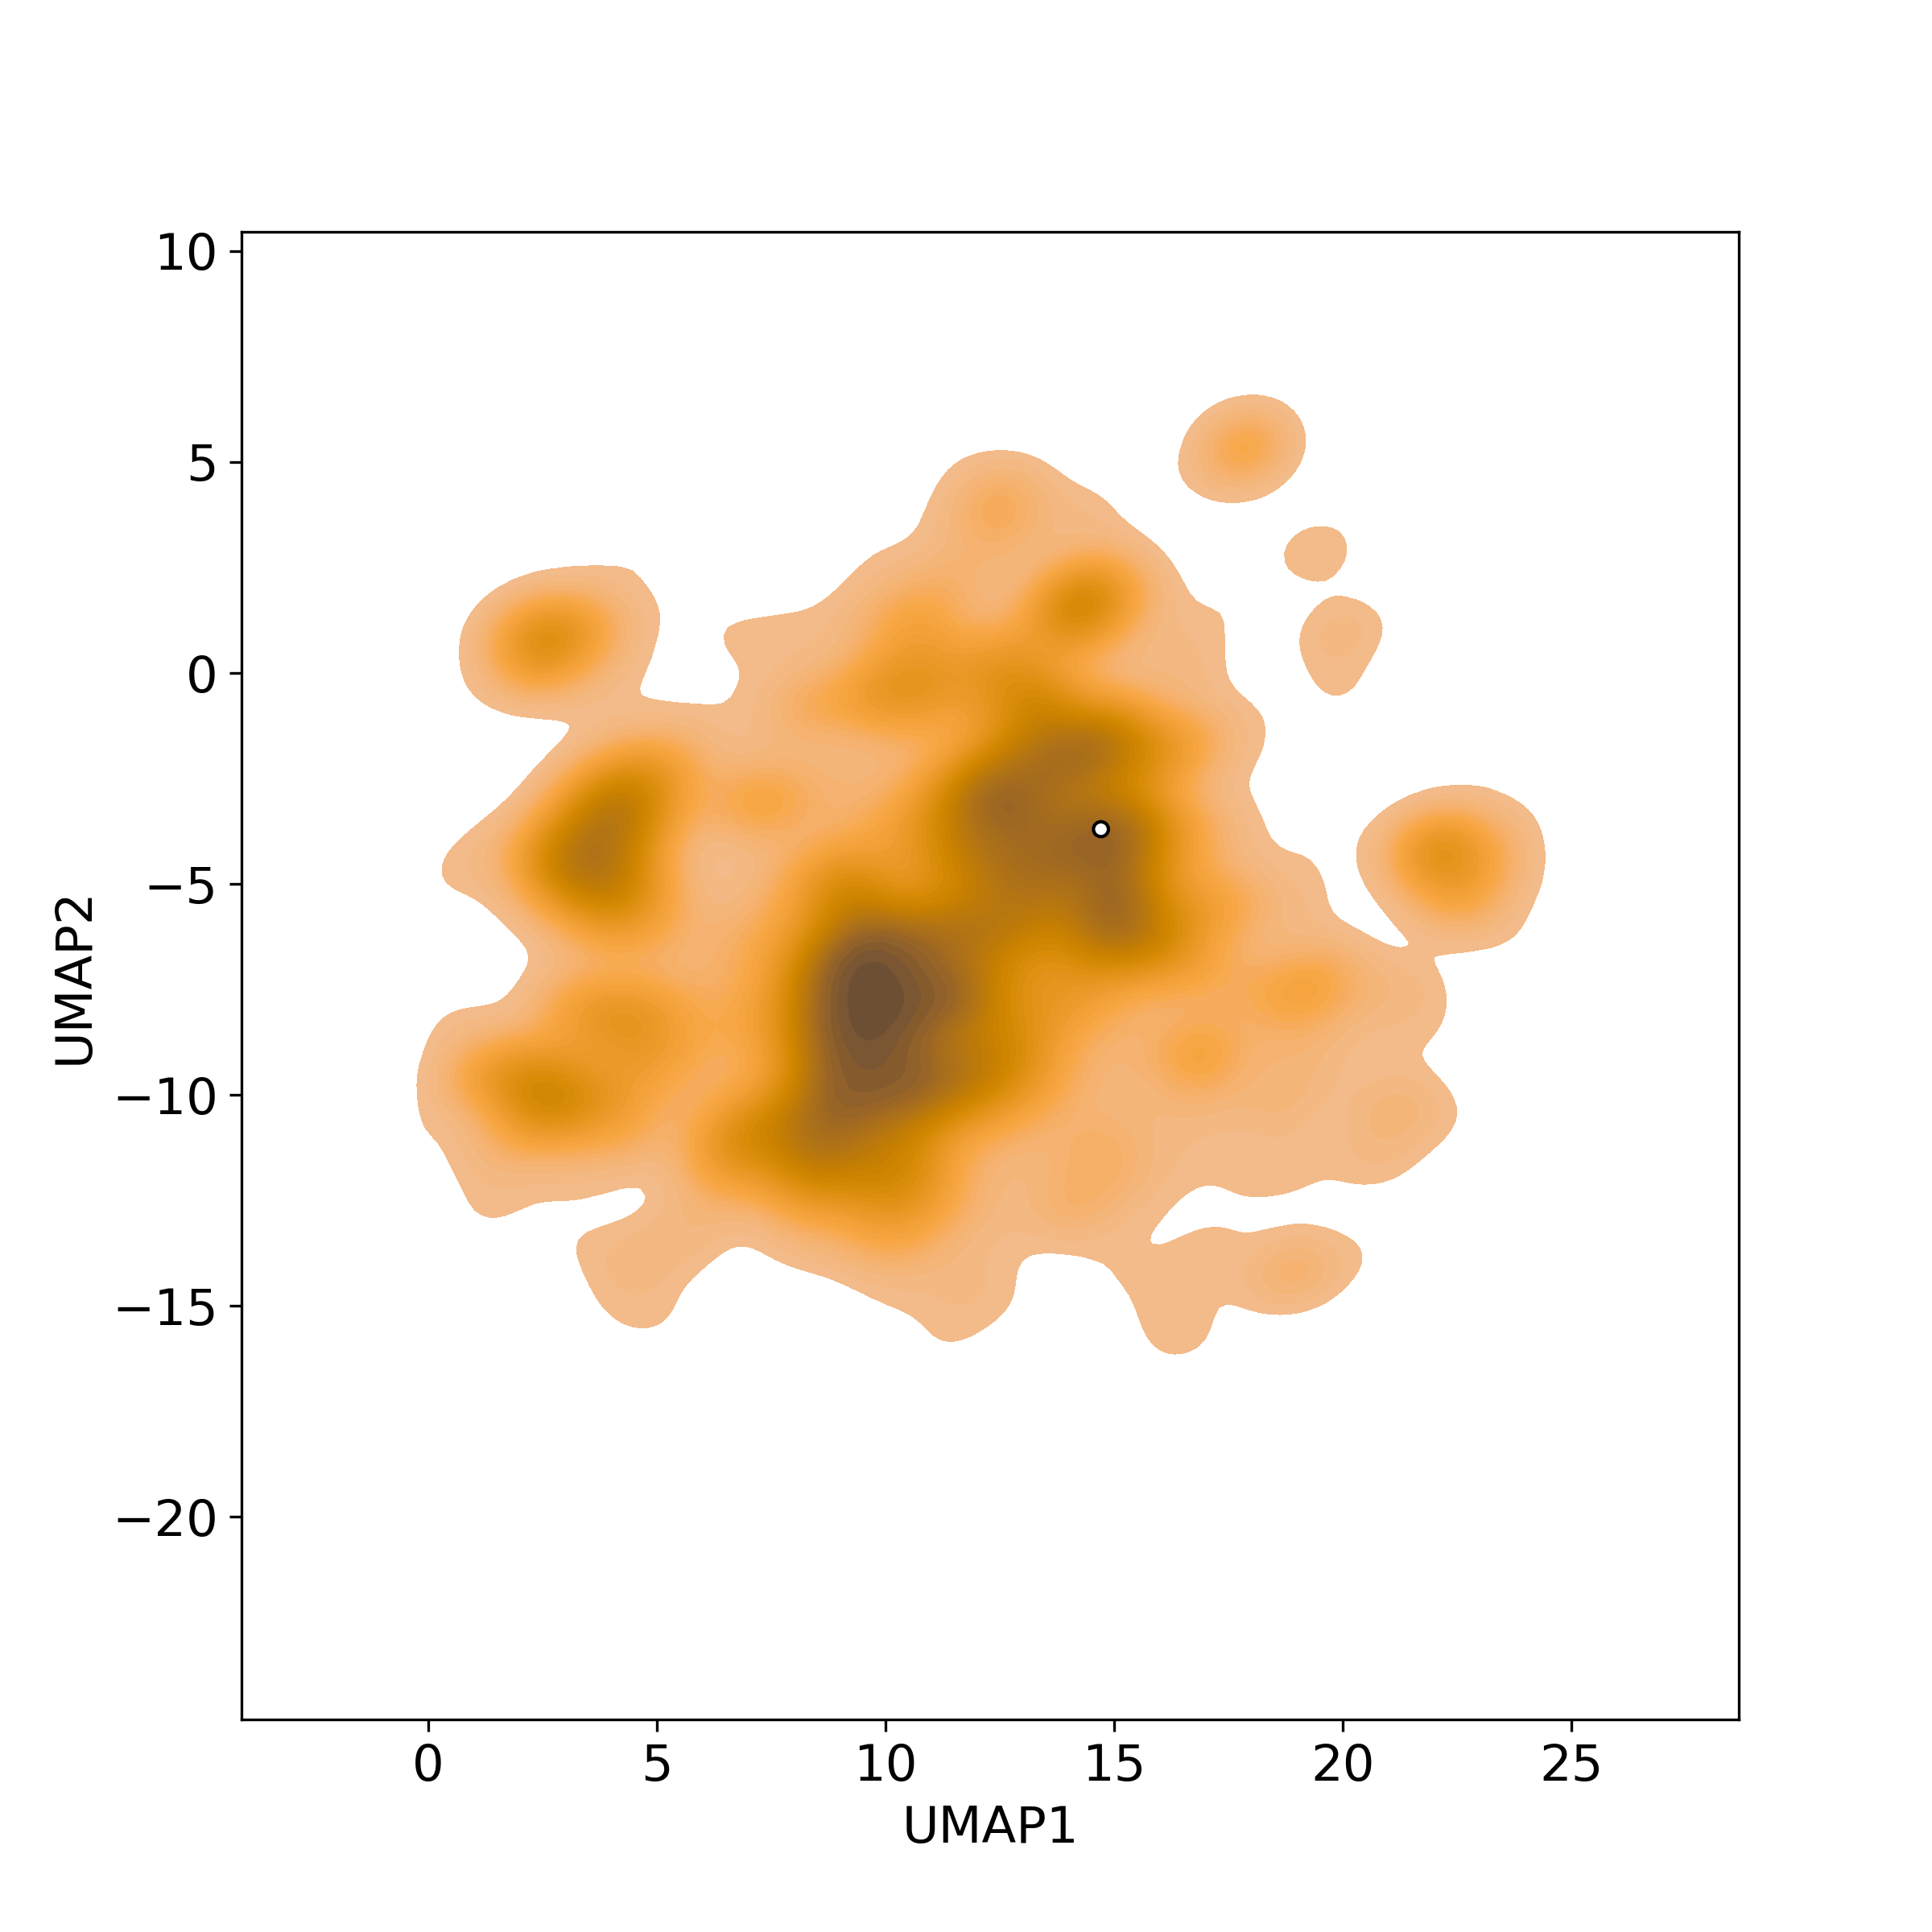
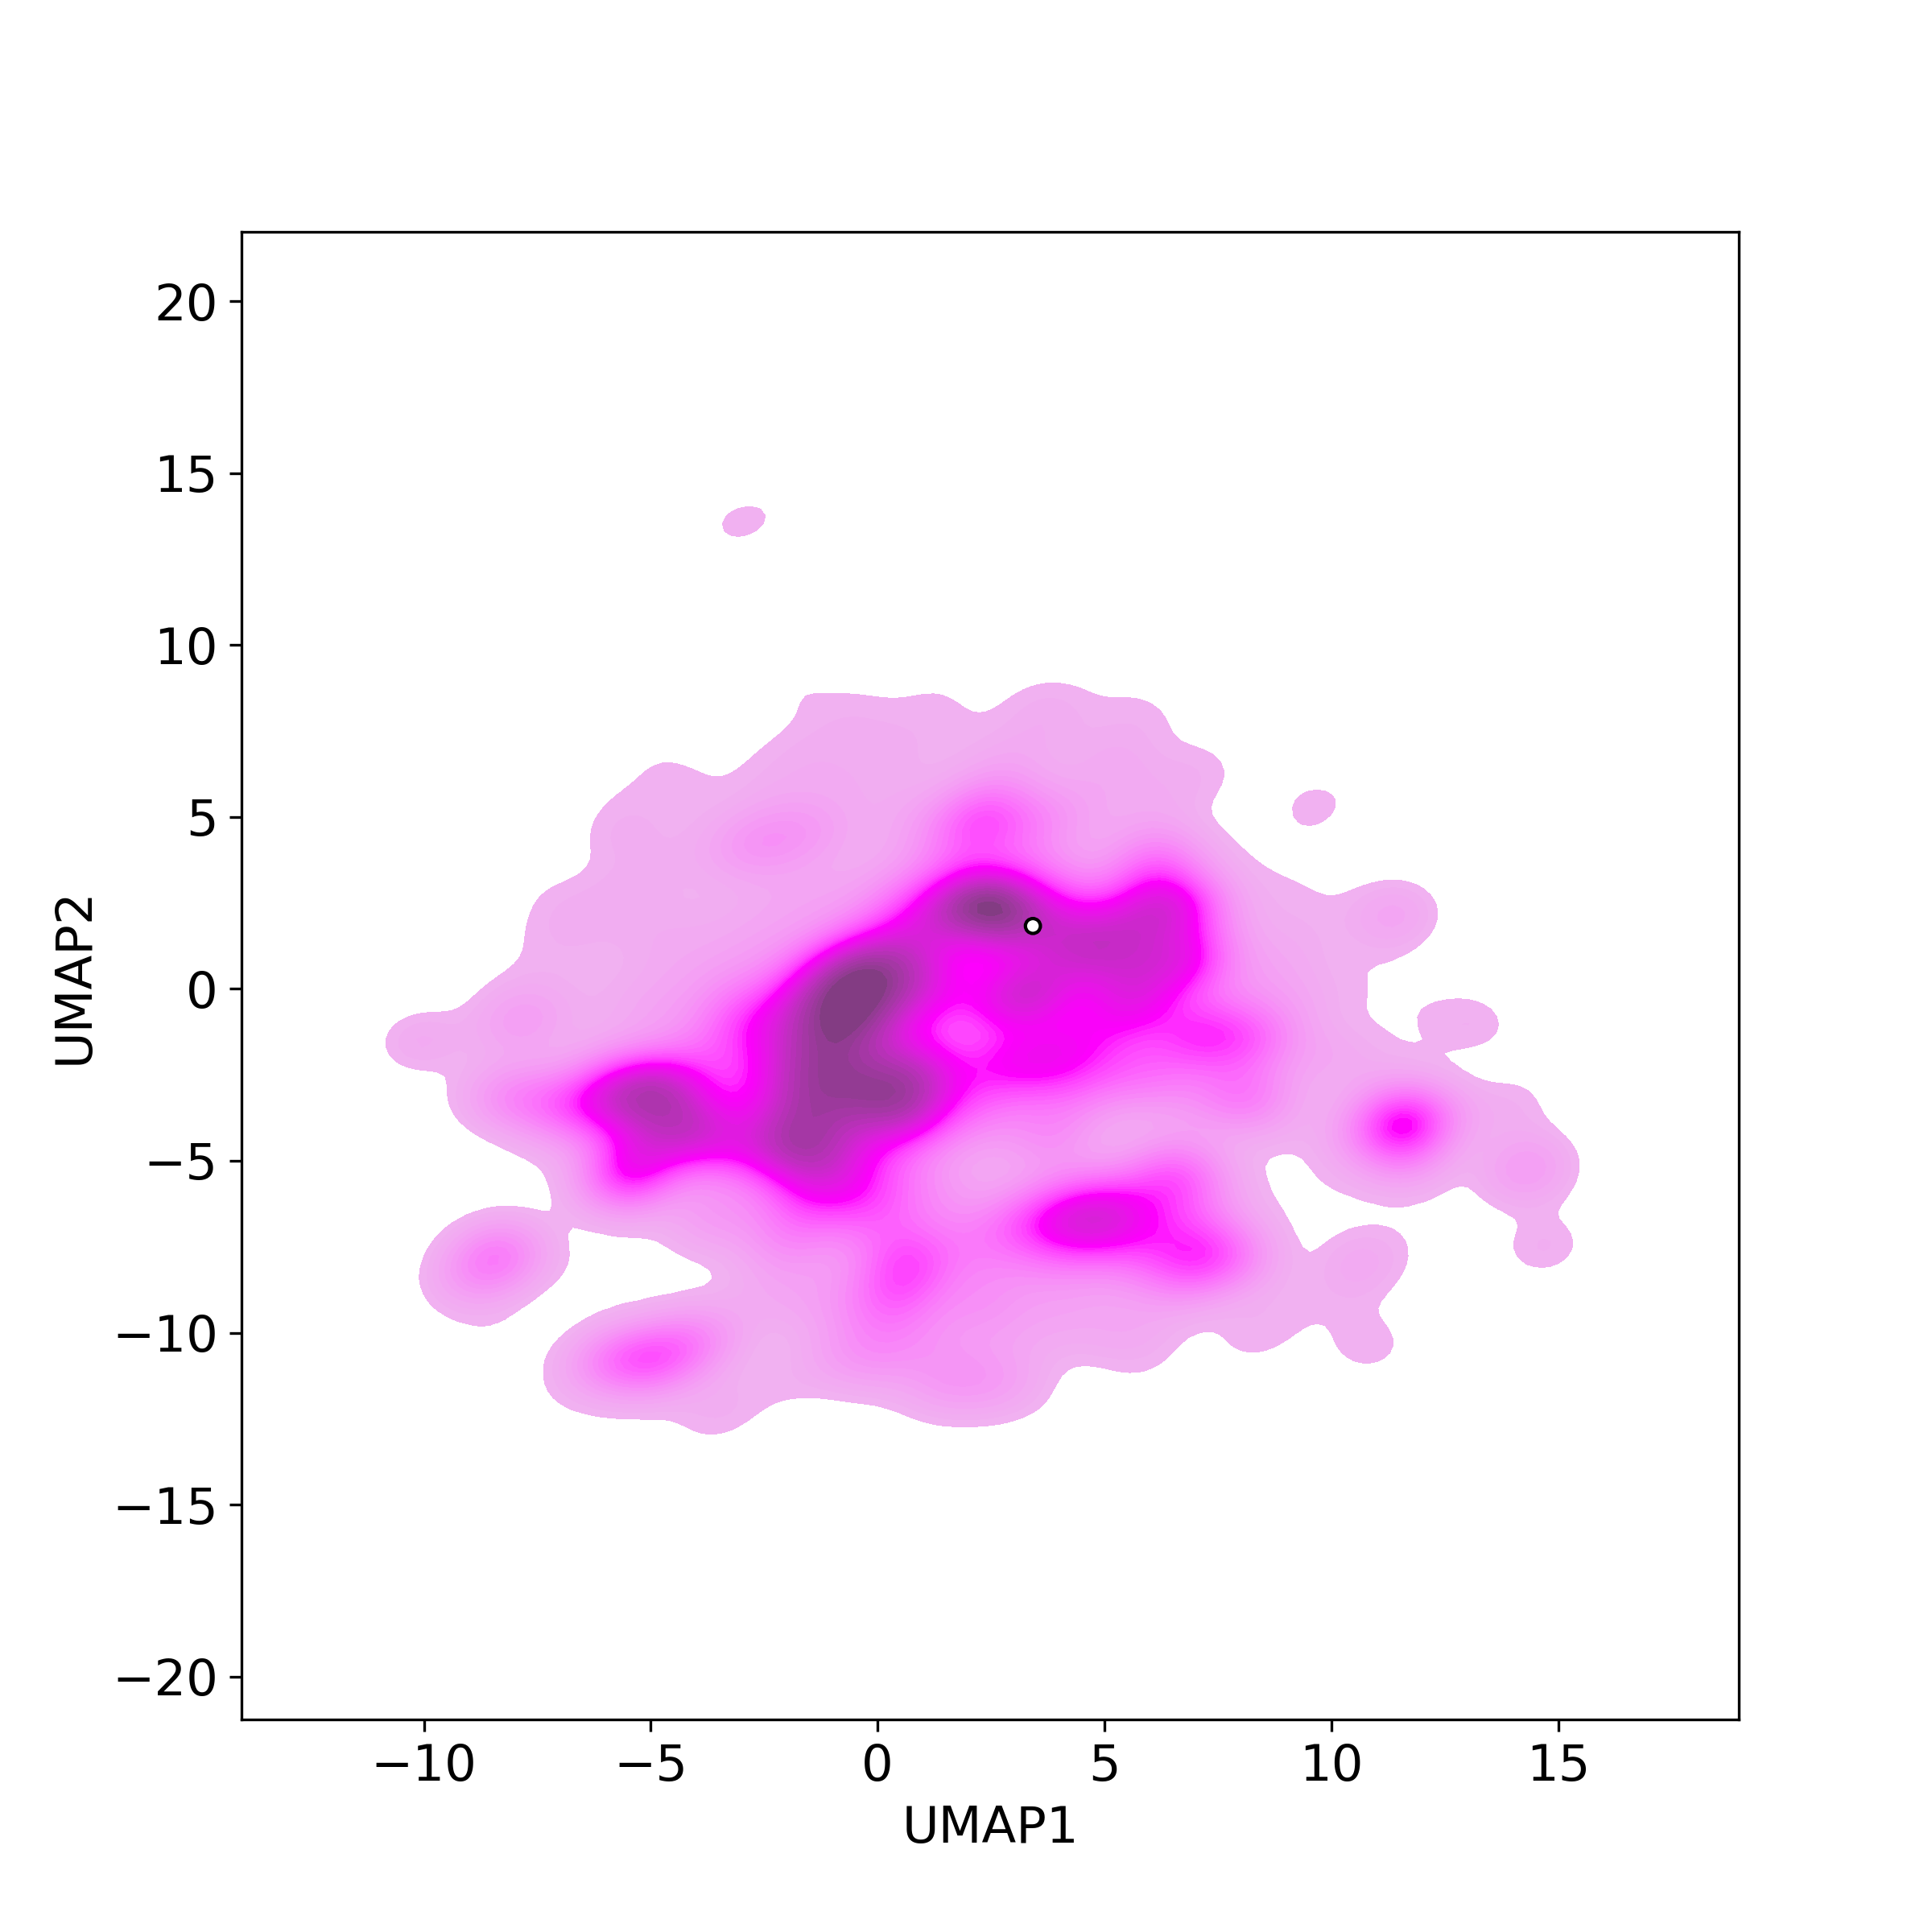
Bioactivity similarity
 Bioactivity similarity
Similar Natural Products in NPASS
Similarity level is defined by Bioactivity similarity was calculated based on bioactivity descriptors of compounds. The bioactivity descriptors were calculated by a recently developed AI algorithm Chemical Checker (CC) [Nature Biotechnology, 38:1087–1096, 2020; Nature Communications, 12:3932, 2021], which evaluated bioactivity similarities at five levels:
☉ A: chemistry similarity;
☉ B: biological targets similarity;
☉ C: networks similarity;
☉ D: cell-based bioactivity similarity;
☉ E: similarity based on clinical data.
Those 5 categories of CC bioactivity descriptors were calculated and then subjected to manifold projection using UMAP algorithm, to project all NPs on a 2-Dimensional space. The current NP was highlighted with a small circle in the 2-D map. Below figures: left-to-right, A-to-E.