Natural Product: NPC218092
| Natural Product ID | NPC218092 |
|
Common Name
The InCHIKey will be temporarily assigned as the "Common Name" if no IUPAC name or alternative short name is available.
| (5S,5Ar,8Ar)-5-(1,3-Benzodioxol-5-Yl)-5A,8,8A,9-Tetrahydro-5H-[2]Benzofuro[5,6-F][1,3]Benzodioxol-6-One |
| IUPAC Name | (5S,5aR,8aR)-5-(1,3-benzodioxol-5-yl)-5a,8,8a,9-tetrahydro-5H-[2]benzofuro[5,6-f][1,3]benzodioxol-6-one |
| Synonyms | |
| Synthetic Gene Cluster | n.a. |
| ChEMBL Identifier | CHEMBL1976899 |
| PubChem CID |
386603 |
| Chemical Classification |
|
The Chemical Classification was calculated by Classyfire, a software for chemical taxonomy calculation. Reference: DOI:10.1186/s13321-016-0174-y.
 Chemical Representations
| Standard InCHIKey | SCTKDFCQZSBHEE-NXXSPTCGSA-N |
| Standard InCHI | InChI=1S/C20H16O6/c21-20-19-12(7-22-20)3-11-5-16-17(26-9-25-16)6-13(11)18(19)10-1-2-14-15(4-10)24-8-23-14/h1-2,4-6,12,18-19H,3,7-9H2/t12-,18-,19-/m0/s1 |
| SMILES | c1cc2c(cc1[C@H]1c3cc4c(cc3C[C@H]3COC(=O)[C@H]13)OCO4)OCO2 |
 Calculated Properties
Physi-Chem Properties
MedChem Properties
ADMET Properties (ADMETlab3.0)
ADMET: Absorption
ADMET: Distribution
ADMET: Metabolism
ADMET: Excretion
ADMET: Toxicity
 Species Source
| Organism ID | Organism Name | Taxonomy Level | Family | SuperKingdom | Isolation Part | Collection Location | Collection Time | Reference |
|---|---|---|---|---|---|---|---|---|
| NPO9031 | Euonymus europaeus | Species | Celastraceae | Eukaryota | n.a. | n.a. | n.a. | Database[COCONUT] |
| NPO1040 | Ficus conraui | Species | Moraceae | Eukaryota | n.a. | n.a. | n.a. | Database[COCONUT] |
| NPO103 | Stereocaulon salazinum | Species | Stereocaulaceae | Eukaryota | n.a. | n.a. | n.a. | Database[COCONUT] |
| NPO617 | Vicia balansae | Species | Fabaceae | Eukaryota | n.a. | n.a. | n.a. | Database[COCONUT] |
| NPO9031 | Euonymus europaeus | Species | Celastraceae | Eukaryota | n.a. | n.a. | n.a. | Database[HerDing] |
| NPO9031 | Euonymus europaeus | Species | Celastraceae | Eukaryota | n.a. | n.a. | n.a. | Database[TCMID] |
| NPO1040 | Ficus conraui | Species | Moraceae | Eukaryota | n.a. | n.a. | n.a. | Database[UNPD] |
| NPO617 | Vicia balansae | Species | Fabaceae | Eukaryota | n.a. | n.a. | n.a. | Database[UNPD] |
| NPO9031 | Euonymus europaeus | Species | Celastraceae | Eukaryota | n.a. | n.a. | n.a. | Database[UNPD] |
| NPO103 | Stereocaulon salazinum | Species | Stereocaulaceae | Eukaryota | n.a. | n.a. | n.a. | Database[UNPD] |
Note for Reference:
In addition to directly collecting NP source organism data from primary literature (where reference will provided as NCBI PMID or DOI links), NPASS also integrated them from below databases:
☉ UNPD: Universal Natural Products Database [PMID: 23638153].
☉ StreptomeDB: a database of streptomycetes natural products [PMID: 33051671].
☉ TM-MC: a database of medicinal materials and chemical compounds in Northeast Asian traditional medicine [PMID: 26156871].
☉ TCM@Taiwan: a Traditional Chinese Medicine database [PMID: 21253603].
☉ TCMID: a Traditional Chinese Medicine database [PMID: 29106634].
☉ TCMSP: The traditional Chinese medicine systems pharmacology database and analysis platform [PMID: 24735618].
☉ HerDing: a herb recommendation system to treat diseases using genes and chemicals [PMID: 26980517].
☉ MetaboLights: a metabolomics database [PMID: 27010336].
☉ FooDB: a database of constituents, chemistry and biology of food species [www.foodb.ca].
 NP Quantity Composition/Concentration
| Organism ID | Organism Name | Organism Material Preparation | Organism Part | NP Quantity (Standard) | NP Quantity (Minimum) | NP Quantity (Maximum) | Quantity Unit | Reference |
|---|
Note for Reference:
In addition to directly collecting NP quantitative data from primary literature (where reference will provided as NCBI PMID or DOI links), NPASS also integrated NP quantitative records for specific NP domains (e.g., NPS from foods or herbs) from domain-specific databases. These databases include:
☉ DUKE: Dr. Duke's Phytochemical and Ethnobotanical Databases.
☉ PHENOL EXPLORER: is the first comprehensive database on polyphenol content in foods [PMID: 24103452], its homepage can be accessed at here.
☉ FooDB: a database of constituents, chemistry and biology of food species [www.foodb.ca].
 Biological Activity
Molecular-level activity
| Target ID | Target Type | Target Name | Target Organism | Activity Type | Activity Relation | Value | Unit | Reference |
|---|
In vitro activity
| Target ID | Target Type | Target Name | Target Organism | Activity Type | Activity Relation | Value | Unit | Reference |
|---|---|---|---|---|---|---|---|---|
| NPT368 | Cell line | SN12C | Homo sapiens | GI50 | n.a. | 21928.05 | nM | PubChem BioAssay data set |
| NPT367 | Cell line | MDA-N | Homo sapiens | GI50 | n.a. | 12022.64 | nM | PubChem BioAssay data set |
| NPT369 | Cell line | ACHN | Homo sapiens | GI50 | n.a. | 25003.45 | nM | PubChem BioAssay data set |
| NPT370 | Cell line | NCI-H23 | Homo sapiens | GI50 | n.a. | 25003.45 | nM | PubChem BioAssay data set |
| NPT371 | Cell line | UO-31 | Homo sapiens | GI50 | n.a. | 15595.53 | nM | PubChem BioAssay data set |
| NPT116 | Cell line | HL-60 | Homo sapiens | GI50 | n.a. | 10616.96 | nM | PubChem BioAssay data set |
| NPT90 | Cell line | DU-145 | Homo sapiens | GI50 | n.a. | 25003.45 | nM | PubChem BioAssay data set |
| NPT373 | Cell line | SK-MEL-5 | Homo sapiens | GI50 | n.a. | 16032.45 | nM | PubChem BioAssay data set |
| NPT375 | Cell line | Malme-3M | Homo sapiens | GI50 | n.a. | 25003.45 | nM | PubChem BioAssay data set |
| NPT111 | Cell line | K562 | Homo sapiens | GI50 | n.a. | 11994.99 | nM | PubChem BioAssay data set |
| NPT377 | Cell line | OVCAR-3 | Homo sapiens | GI50 | n.a. | 25003.45 | nM | PubChem BioAssay data set |
| NPT112 | Cell line | MOLT-4 | Homo sapiens | GI50 | n.a. | 4111.5 | nM | PubChem BioAssay data set |
| NPT379 | Cell line | HOP-62 | Homo sapiens | GI50 | n.a. | 24660.39 | nM | PubChem BioAssay data set |
| NPT380 | Cell line | U-251 | Homo sapiens | GI50 | n.a. | 25003.45 | nM | PubChem BioAssay data set |
| NPT378 | Cell line | NCI/ADR-RES | Homo sapiens | GI50 | n.a. | 9332.54 | nM | PubChem BioAssay data set |
| NPT381 | Cell line | OVCAR-8 | Homo sapiens | GI50 | n.a. | 25003.45 | nM | PubChem BioAssay data set |
| NPT382 | Cell line | OVCAR-5 | Homo sapiens | GI50 | n.a. | 25003.45 | nM | PubChem BioAssay data set |
| NPT383 | Cell line | SNB-19 | Homo sapiens | GI50 | n.a. | 25003.45 | nM | PubChem BioAssay data set |
| NPT82 | Cell line | MDA-MB-231 | Homo sapiens | GI50 | n.a. | 22698.65 | nM | PubChem BioAssay data set |
| NPT384 | Cell line | TK-10 | Homo sapiens | GI50 | n.a. | 25003.45 | nM | PubChem BioAssay data set |
| NPT385 | Cell line | SR | Homo sapiens | GI50 | n.a. | 24043.63 | nM | PubChem BioAssay data set |
| NPT386 | Cell line | KM12 | Homo sapiens | GI50 | n.a. | 25003.45 | nM | PubChem BioAssay data set |
| NPT387 | Cell line | M14 | Homo sapiens | GI50 | n.a. | 25003.45 | nM | PubChem BioAssay data set |
| NPT389 | Cell line | RPMI-8226 | Homo sapiens | GI50 | n.a. | 25003.45 | nM | PubChem BioAssay data set |
| NPT456 | Cell line | OVCAR-4 | Homo sapiens | GI50 | n.a. | 13867.56 | nM | PubChem BioAssay data set |
| NPT390 | Cell line | LOX IMVI | Homo sapiens | GI50 | n.a. | 25003.45 | nM | PubChem BioAssay data set |
| NPT457 | Cell line | BT-549 | Homo sapiens | GI50 | n.a. | 25003.45 | nM | PubChem BioAssay data set |
| NPT147 | Cell line | SK-MEL-2 | Homo sapiens | GI50 | n.a. | 25003.45 | nM | PubChem BioAssay data set |
| NPT81 | Cell line | A549 | Homo sapiens | GI50 | n.a. | 25003.45 | nM | PubChem BioAssay data set |
| NPT391 | Cell line | HCC 2998 | Homo sapiens | GI50 | n.a. | 25003.45 | nM | PubChem BioAssay data set |
| NPT393 | Cell line | HCT-116 | Homo sapiens | GI50 | n.a. | 18238.96 | nM | PubChem BioAssay data set |
| NPT148 | Cell line | HCT-15 | Homo sapiens | GI50 | n.a. | 10990.06 | nM | PubChem BioAssay data set |
| NPT83 | Cell line | MCF7 | Homo sapiens | GI50 | n.a. | 24210.29 | nM | PubChem BioAssay data set |
| NPT394 | Cell line | EKVX | Homo sapiens | GI50 | n.a. | 25003.45 | nM | PubChem BioAssay data set |
| NPT397 | Cell line | NCI-H460 | Homo sapiens | GI50 | n.a. | 25003.45 | nM | PubChem BioAssay data set |
| NPT400 | Cell line | MDA-MB-435 | Homo sapiens | GI50 | n.a. | 13273.94 | nM | PubChem BioAssay data set |
| NPT308 | Cell line | CAKI-1 | Homo sapiens | GI50 | n.a. | 25003.45 | nM | PubChem BioAssay data set |
| NPT399 | Cell line | SF-295 | Homo sapiens | GI50 | n.a. | 24717.24 | nM | PubChem BioAssay data set |
| NPT403 | Cell line | UACC-257 | Homo sapiens | GI50 | n.a. | 25003.45 | nM | PubChem BioAssay data set |
| NPT401 | Cell line | 786-0 | Homo sapiens | GI50 | n.a. | 25003.45 | nM | PubChem BioAssay data set |
| NPT404 | Cell line | CCRF-CEM | Homo sapiens | GI50 | n.a. | 25003.45 | nM | PubChem BioAssay data set |
| NPT139 | Cell line | HT-29 | Homo sapiens | GI50 | n.a. | 24099.05 | nM | PubChem BioAssay data set |
| NPT170 | Cell line | SK-MEL-28 | Homo sapiens | GI50 | n.a. | 25003.45 | nM | PubChem BioAssay data set |
| NPT407 | Cell line | COLO 205 | Homo sapiens | GI50 | n.a. | 25003.45 | nM | PubChem BioAssay data set |
In vivo activity
| Target ID | Target Type | Target Name | Target Organism | Activity Type | Activity Relation | Value | Unit | Reference |
|---|
 Experimental ADME
| Experiment Model | Experiment Tissue | ADME Type | ADME Relation | ADME Value | ADME Unit | Reference |
|---|
 Experimental Toxicity
Quantitative toxicity
| Experiment Model | Experiment Organism | Toxicity Type | Toxicity Relation | Toxicity Value | Toxicity Unit | Reference |
|---|
Common Abbreviations:
LC: Lethal Concentration; LD: Lethal Dose; LT:Lethal Time; NOAEL: No-observed-adverse-effect Level; BMDL: Benchmark Dose Lower Confidence Limit; BMD: Benchmark Dose; BMC:Benchmark Concentration; LOAEL: Lowest Observed Adverse Effect Level; RfD:Reference Dose; RfC:Reference Concentration; MRL: Minimal Risk Level; MEG: Maximum Exposure Guideline; PAC: Protective Action Criteria
Categorical toxicity labels
| Hepatotoxicity | Carcinogenicity | Mutagenicity | Cardiotoxicity | Respiratory Toxicity | Eye Irritation | Endocrine Disruption |
|---|---|---|---|---|---|---|

|

|

|

|

|

|

|
Note for Reference:
In addition to directly collecting NP quantitative data from primary literature (where reference will provided as NCBI PMID or DOI links), NPASS also integrated NP toxicity records from domain-specific databases. These databases include:
☉ ToxValDB: a curated database that compiles quantitative toxicity values for chemicals from diverse public sources to support toxicological research and risk assessment.
☉ TOXRIC: a comprehensive, free-to-access, online database providing toxicological/feature data. The toxicity labels are retrieved from this database. [PMID: 36400569]
 Chemically structural similarity
Similar Active Natural Products in NPASS
Top-200 similar NPs were calculated against the active-NP-set (includes approximately 50,000 NPs with experimentally-derived bioactivity available in NPASS)
Similarity is measured using the Tanimoto coefficient (Tc) , which compares the binary fingerprints of two molecules. Tc is calculated as the intersection divided by the union of '1' bits in the fingerprints, ranging from 0 to 1, with 1 indicating highest similarity.
● The left chart: Distribution of similarity level between NPC218092 and all remaining natural products in the NPASS database.
● The right table: Most similar natural products (Tc>=0.5 or Top200).
| Similarity Score | Similarity Level | Natural Product ID |
|---|---|---|
| 1.0 | High Similarity | NPC246474 |
| 1.0 | High Similarity | NPC162851 |
| 0.8 | Intermediate Similarity | NPC80230 |
| 0.8 | Intermediate Similarity | NPC104024 |
| 0.8 | Intermediate Similarity | NPC101755 |
| 0.8 | Intermediate Similarity | NPC304687 |
| 0.8 | Intermediate Similarity | NPC65574 |
| 0.7857 | Intermediate Similarity | NPC262455 |
| 0.7857 | Intermediate Similarity | NPC177476 |
| 0.7167 | Intermediate Similarity | NPC30009 |
| 0.7167 | Intermediate Similarity | NPC103197 |
| 0.6071 | Remote Similarity | NPC177167 |
| 0.6032 | Remote Similarity | NPC149505 |
| 0.6032 | Remote Similarity | NPC480477 |
| 0.5789 | Remote Similarity | NPC115624 |
| 0.5588 | Remote Similarity | NPC288149 |
| 0.5588 | Remote Similarity | NPC115281 |
| 0.5588 | Remote Similarity | NPC470637 |
| 0.5517 | Remote Similarity | NPC110958 |
| 0.5517 | Remote Similarity | NPC19890 |
| 0.55 | Remote Similarity | NPC17348 |
| 0.5286 | Remote Similarity | NPC163527 |
| 0.5161 | Remote Similarity | NPC205915 |
| 0.5088 | Remote Similarity | NPC476748 |
| 0.5077 | Remote Similarity | NPC239890 |
| 0.5077 | Remote Similarity | NPC209411 |
Similar Clinical/Approved Drugs
Similarity level is defined by Tanimoto coefficient (Tc) between two molecules.
● The left chart: Distribution of similarity level between NPC218092 and all drugs/candidates.
● The right table: Most similar clinical/approved drugs (Tc>=0.5 or Top200).
| Similarity Score | Similarity Level | Drug ID | Developmental Stage |
|---|---|---|---|
| NPD |
Bioactivity similarity
 Bioactivity similarity
Similar Natural Products in NPASS
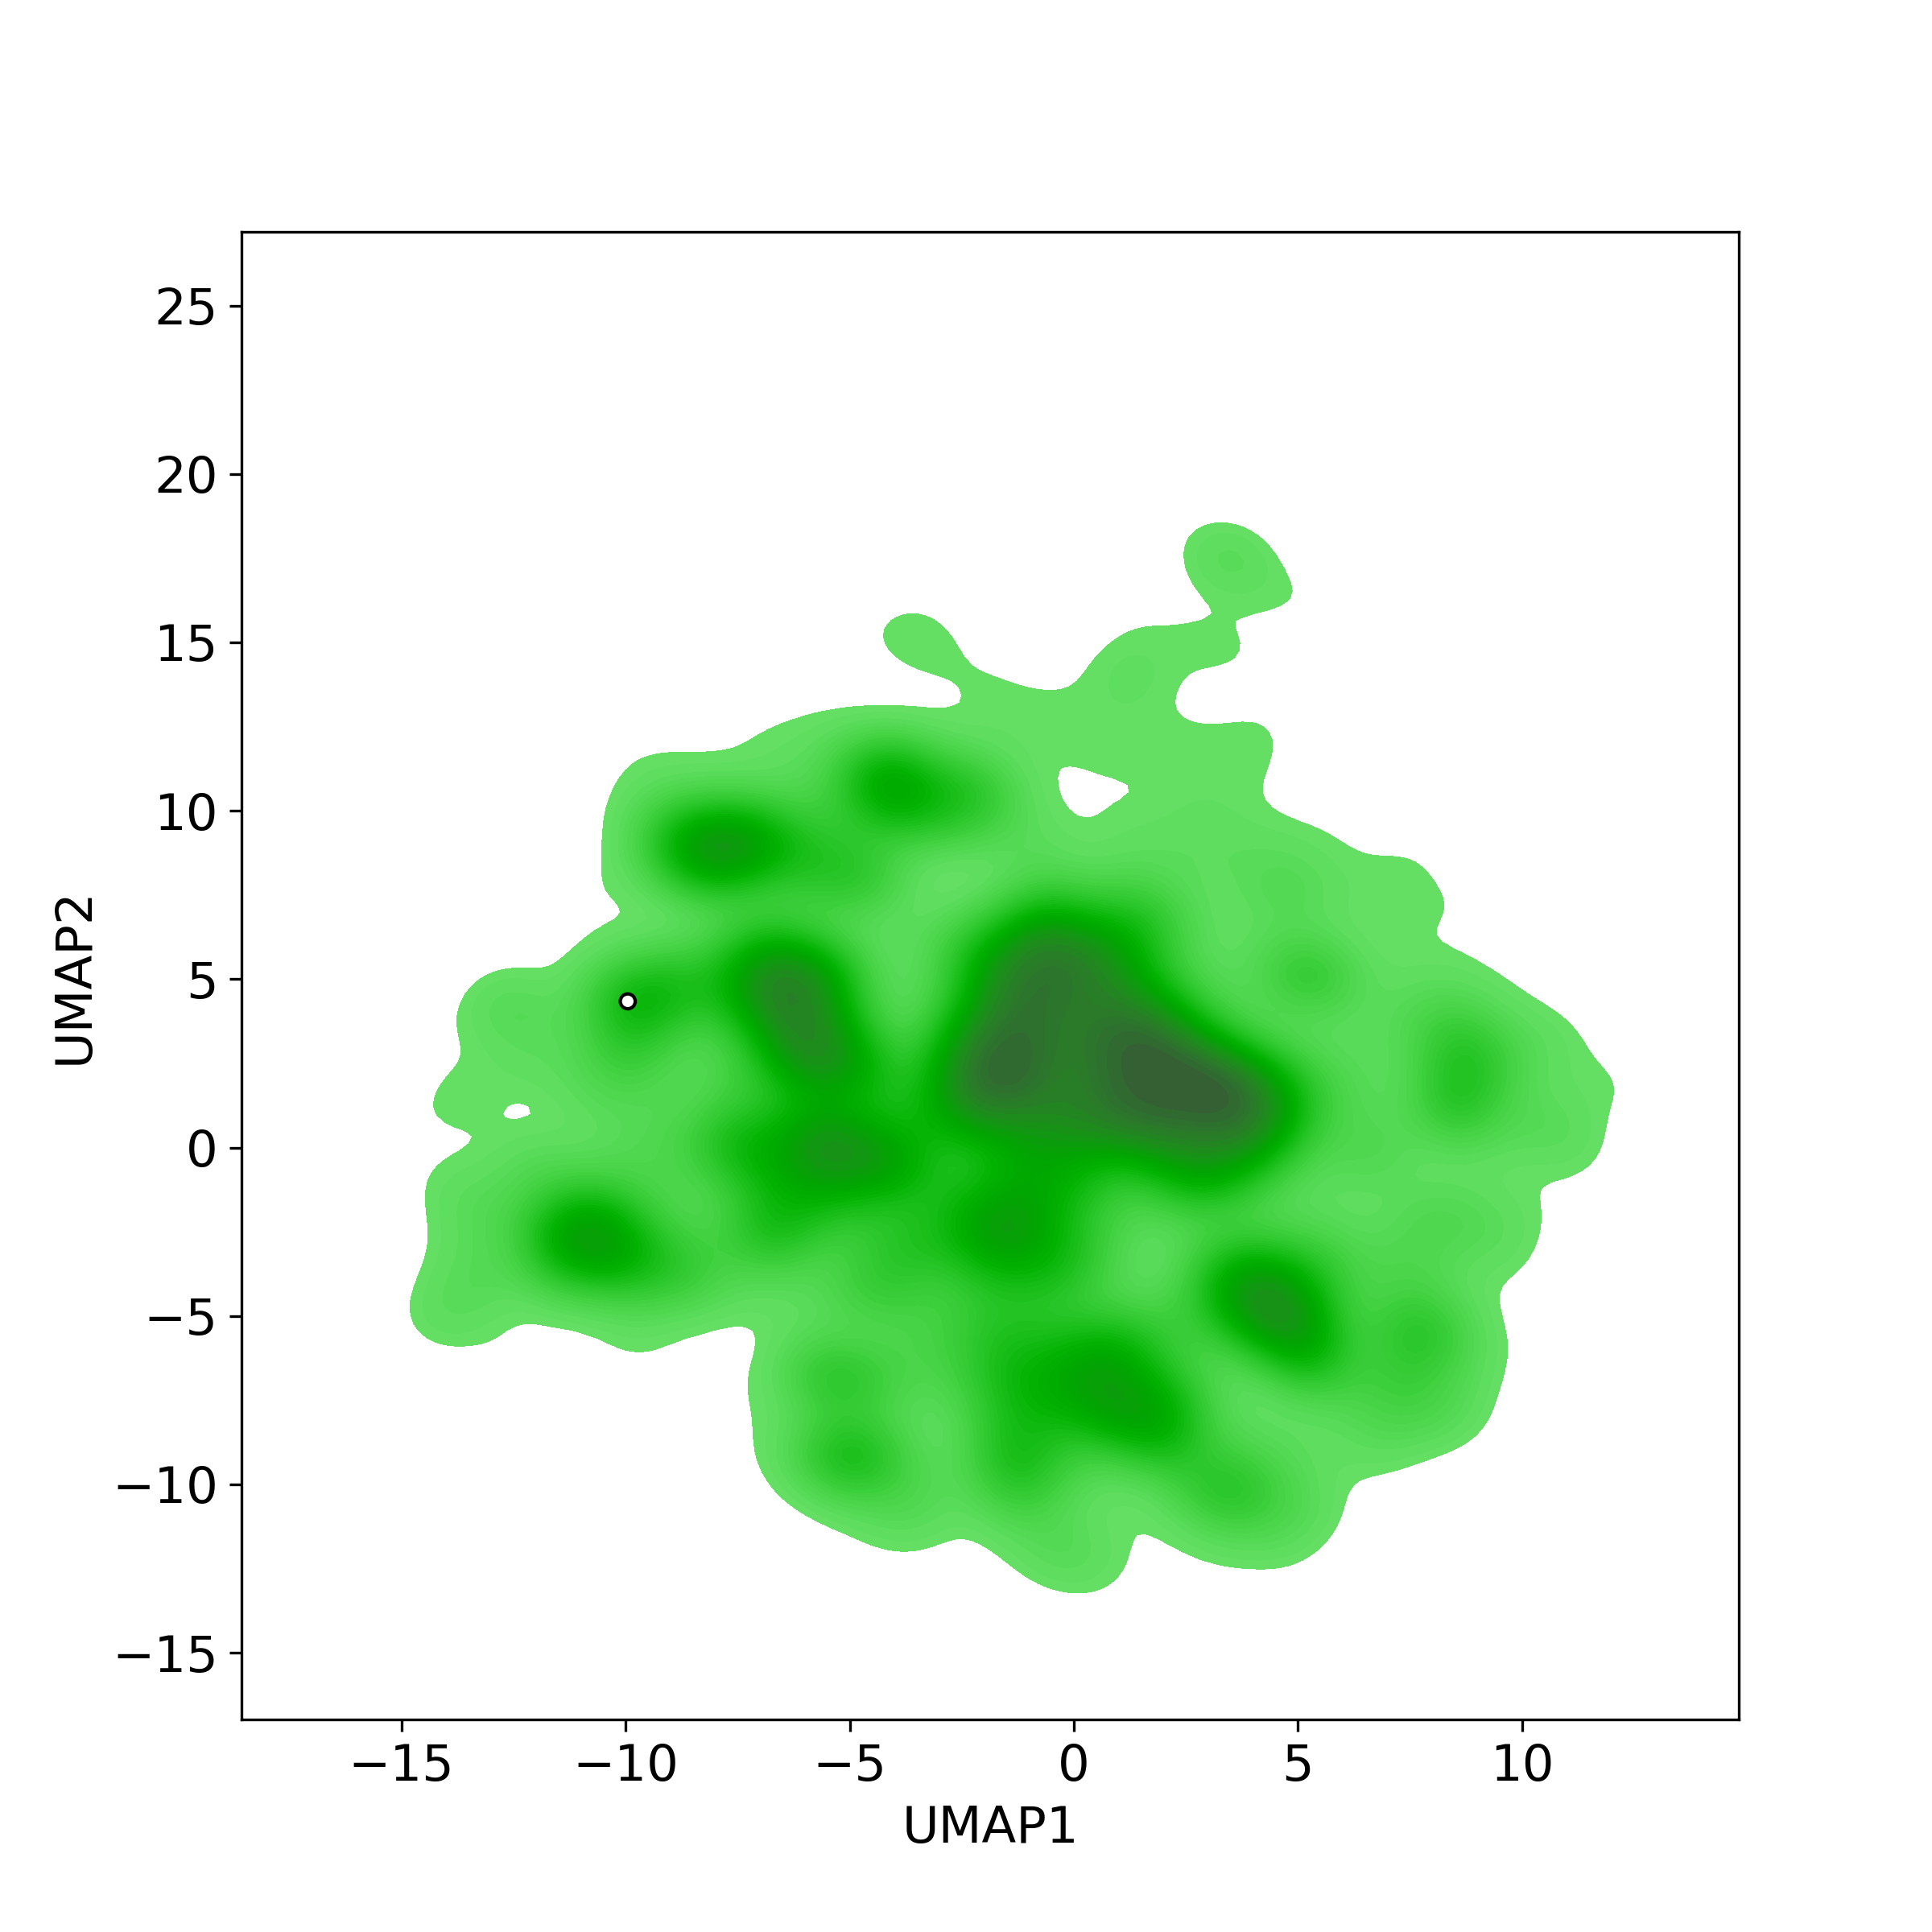
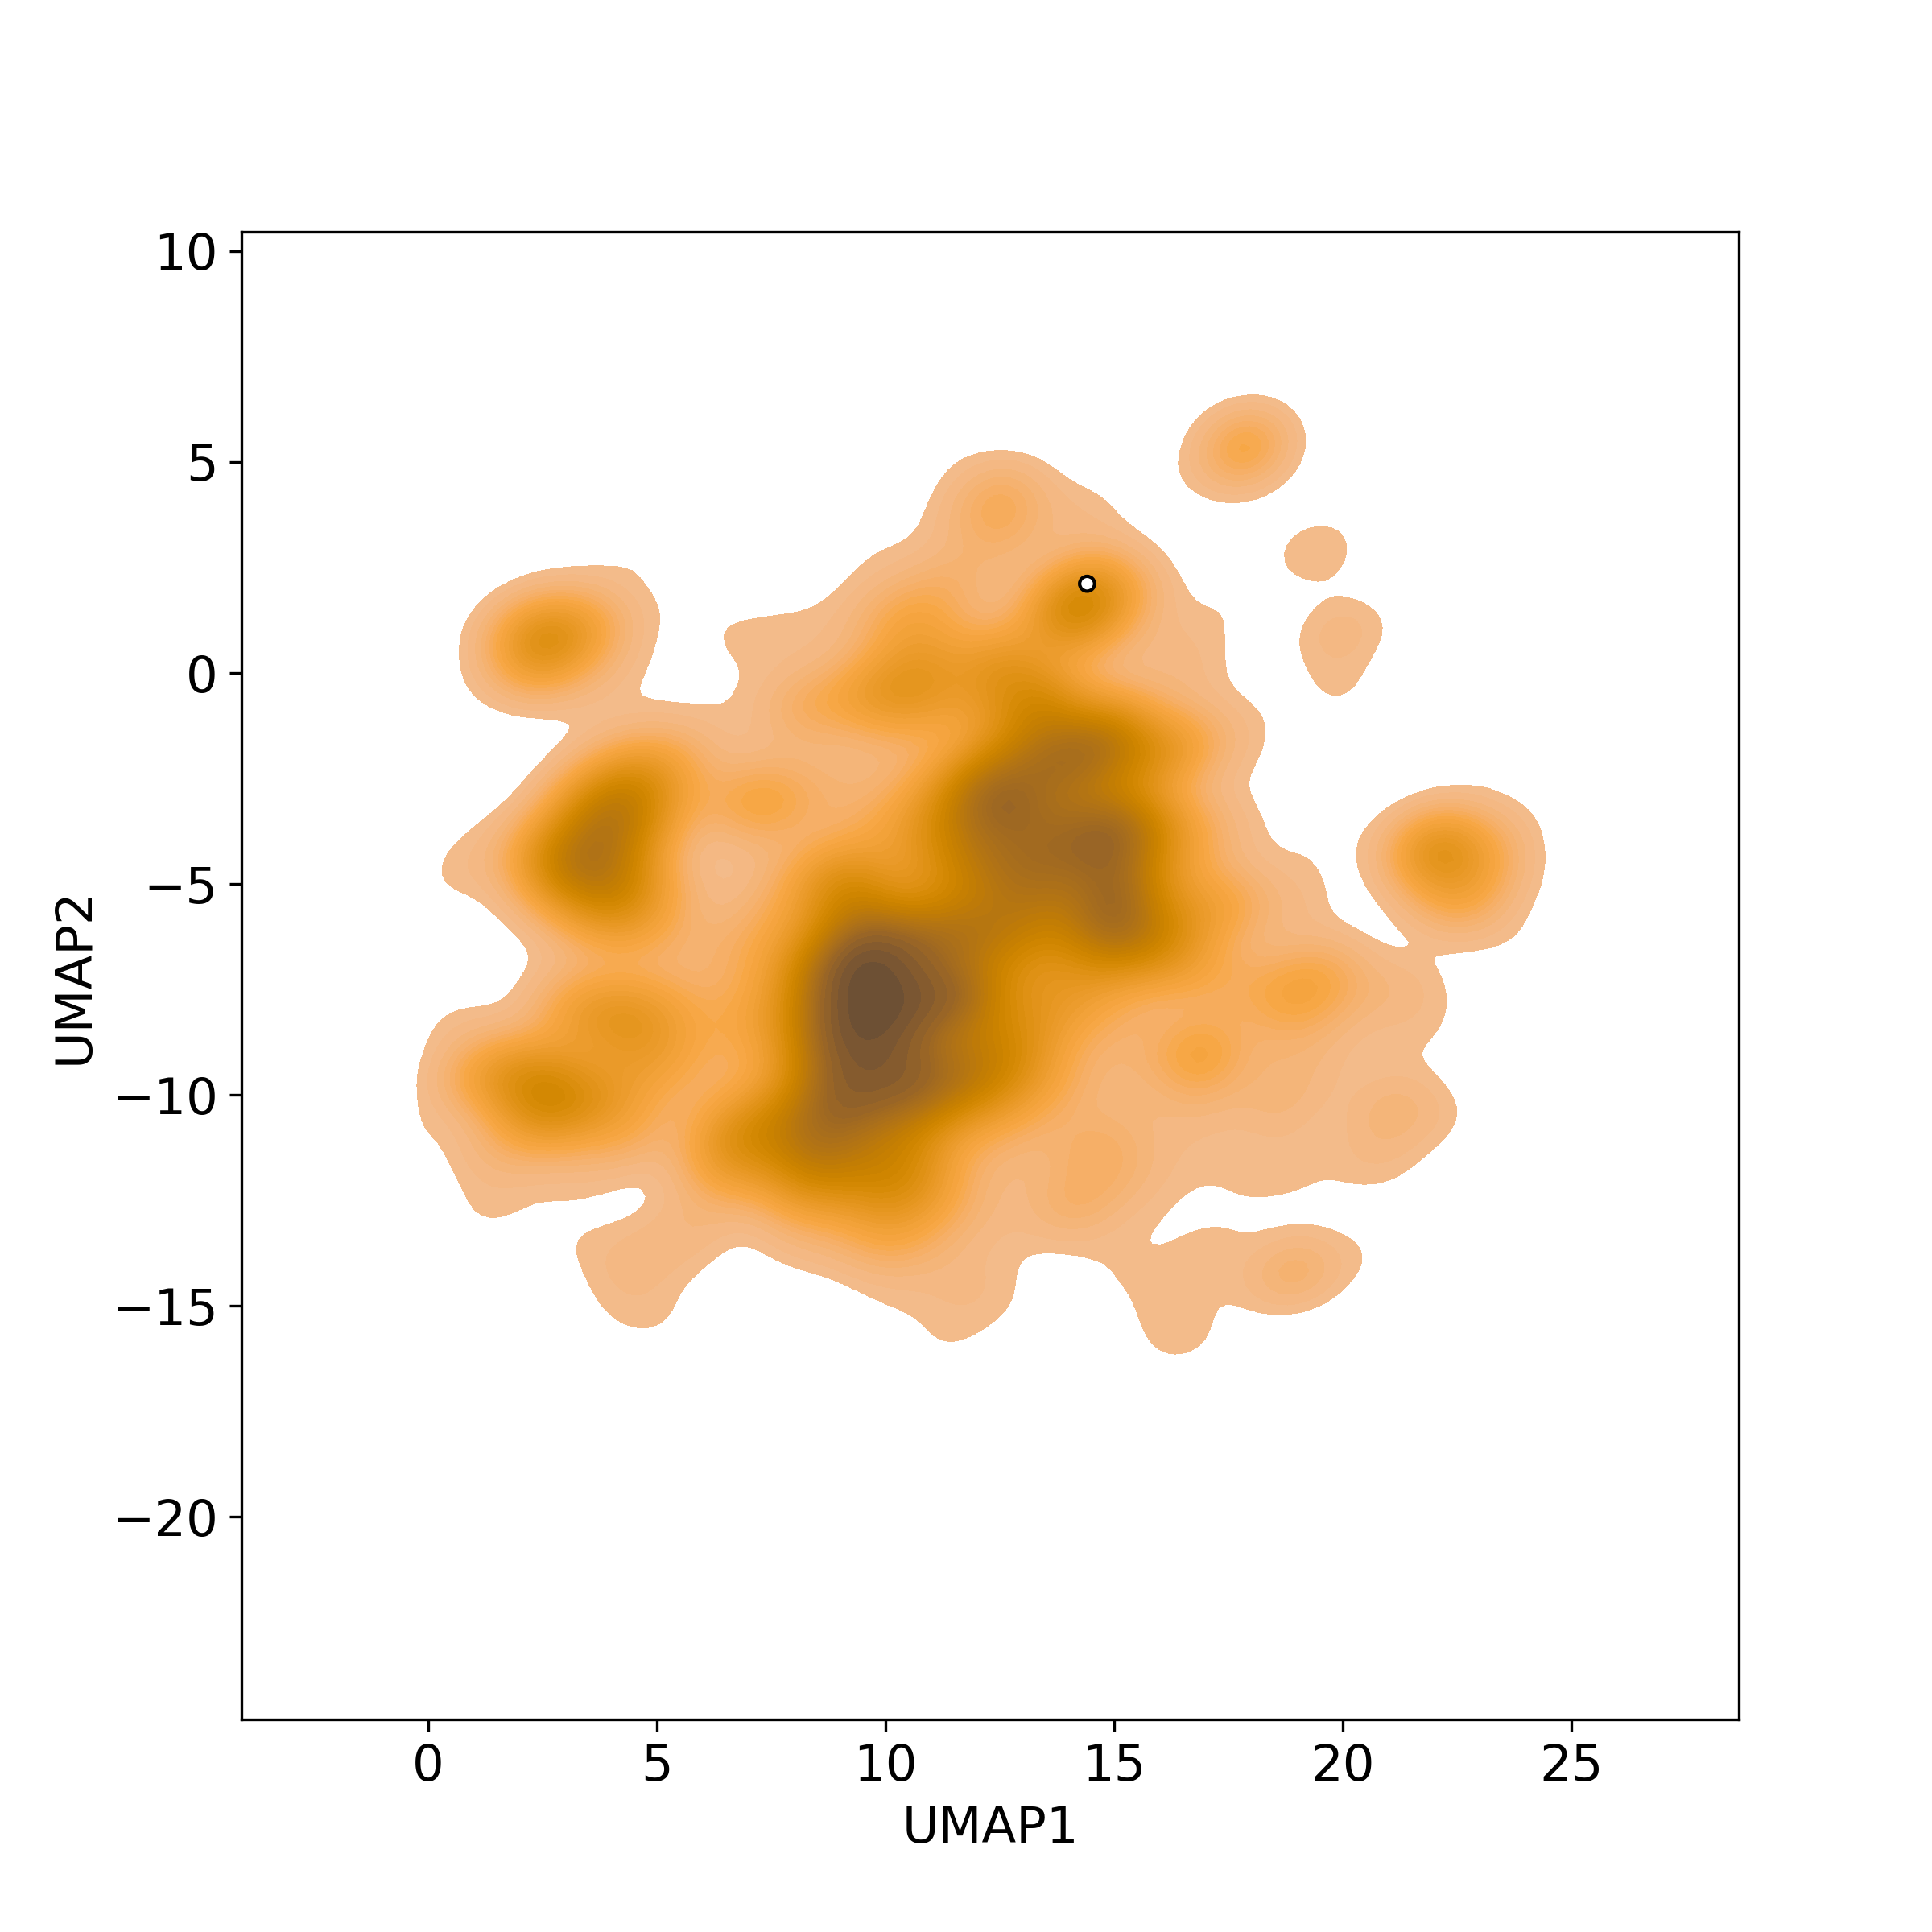
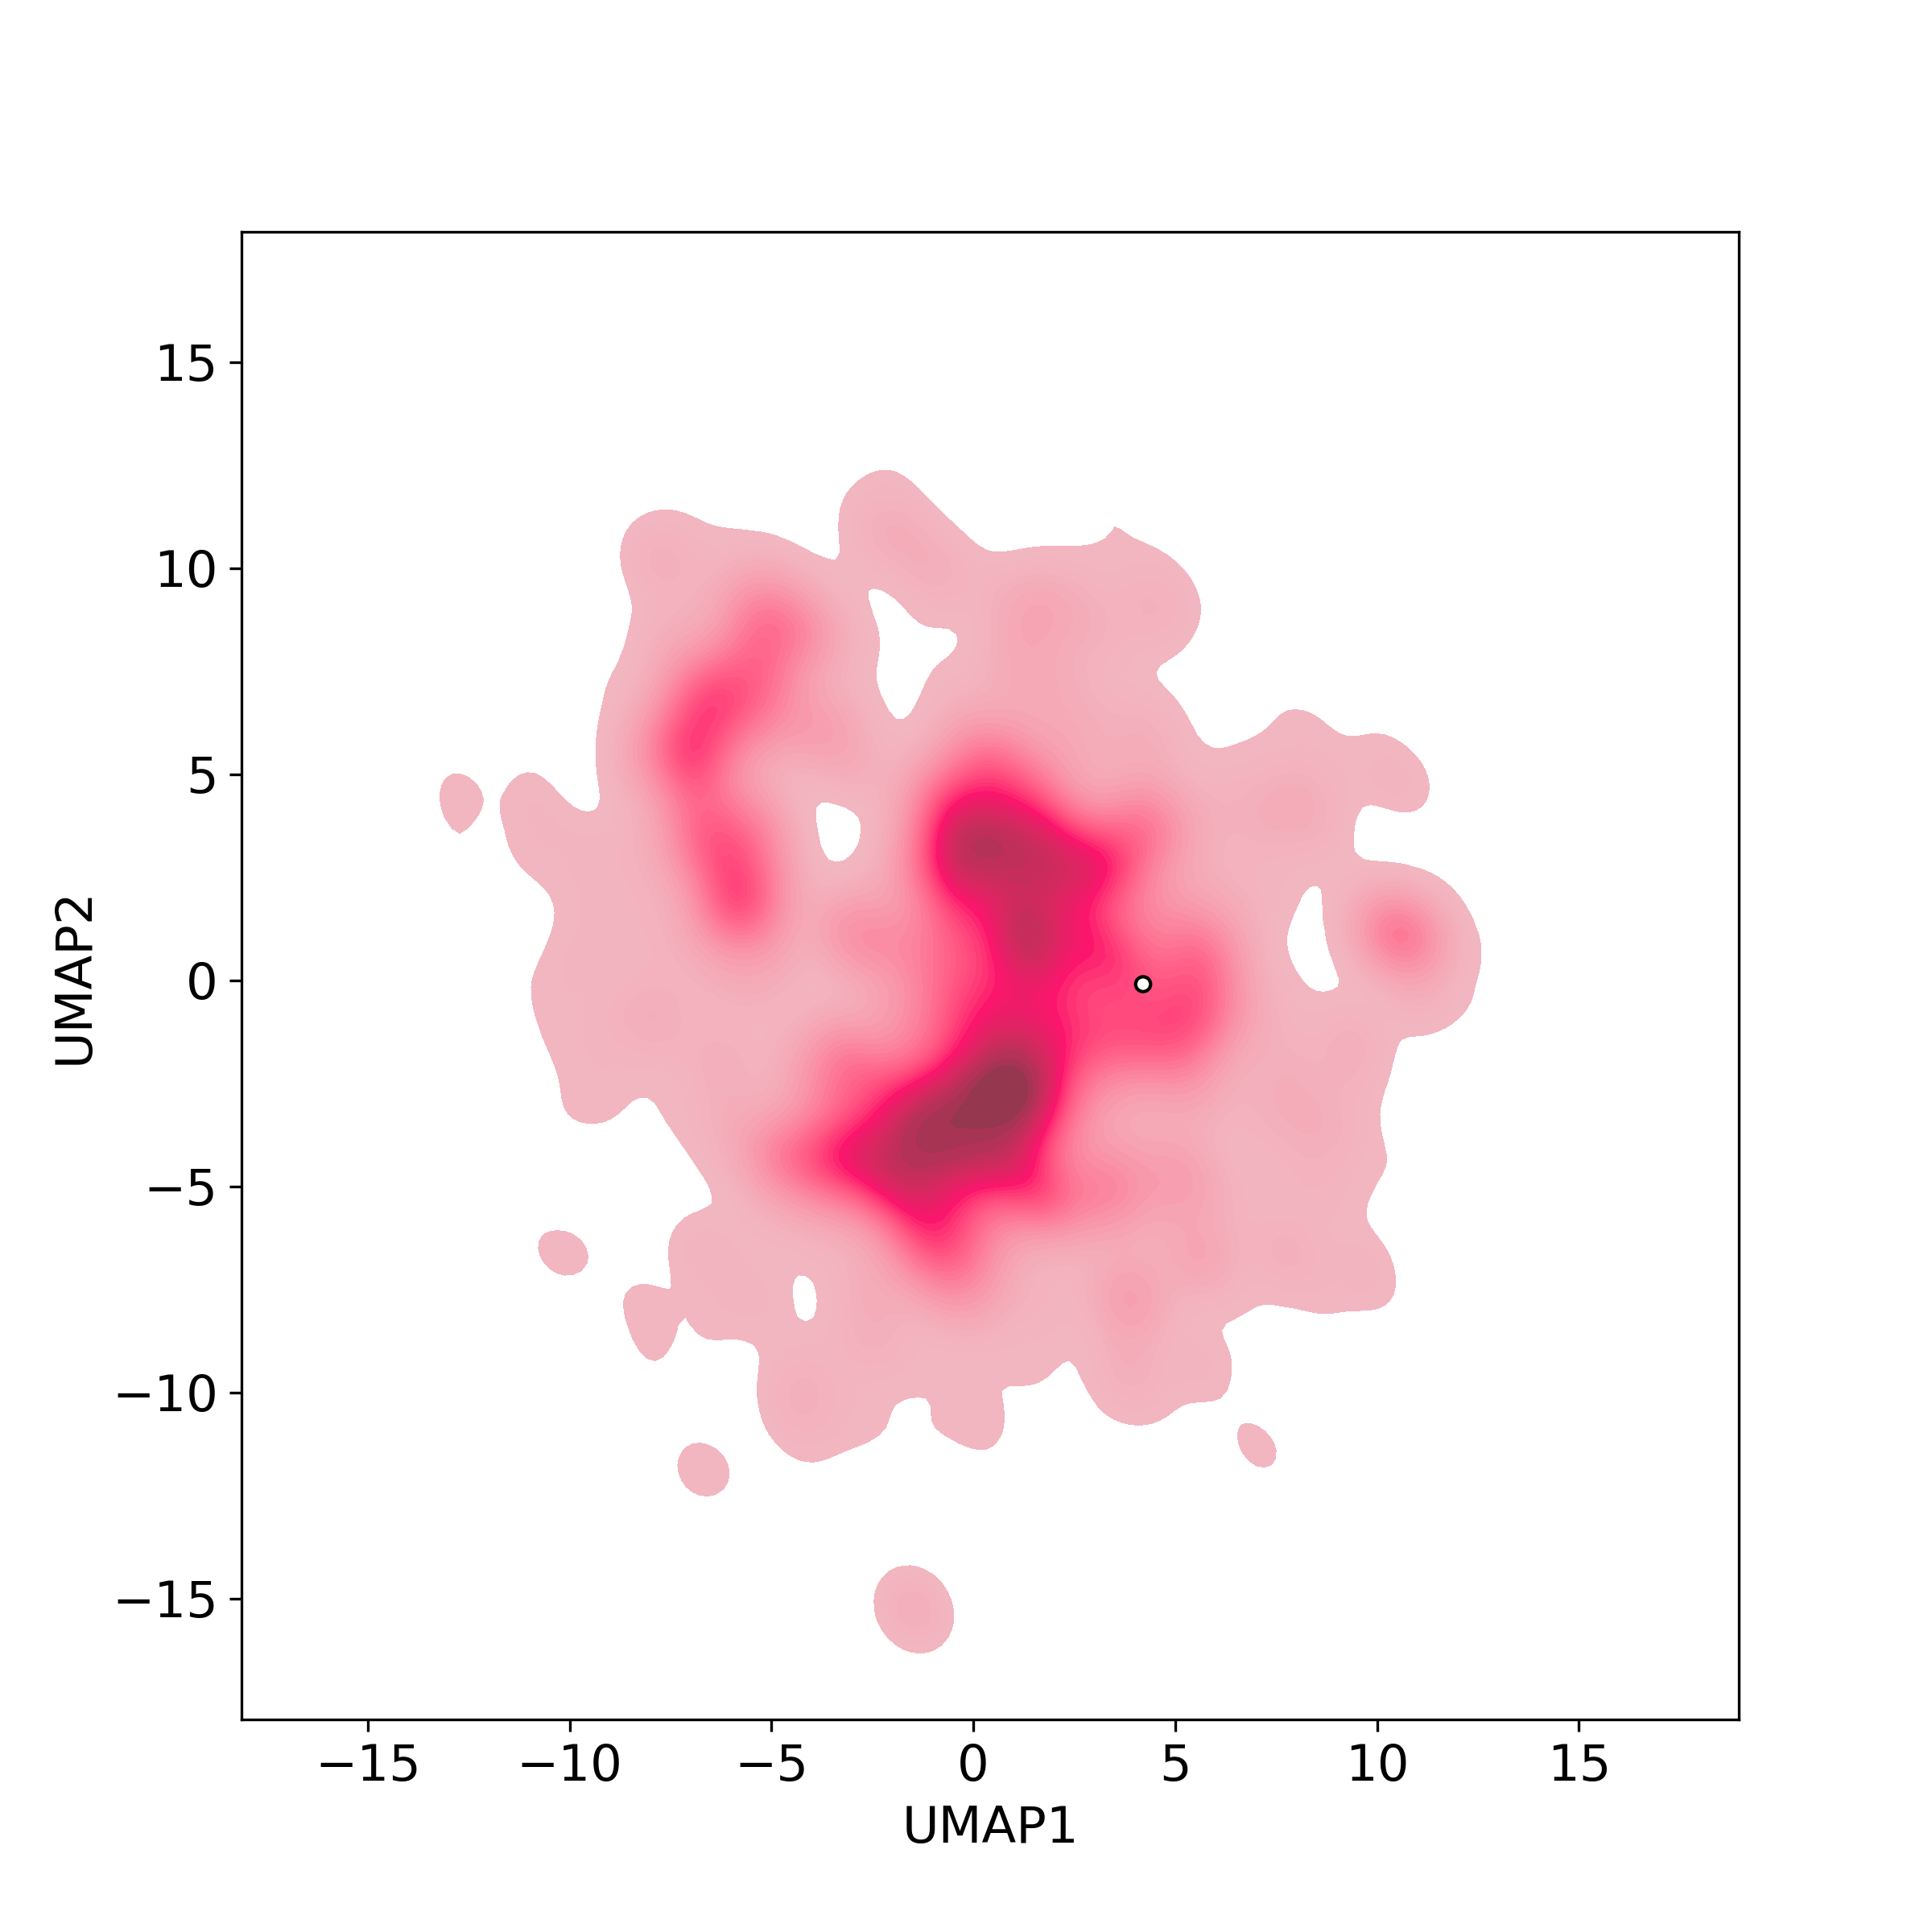
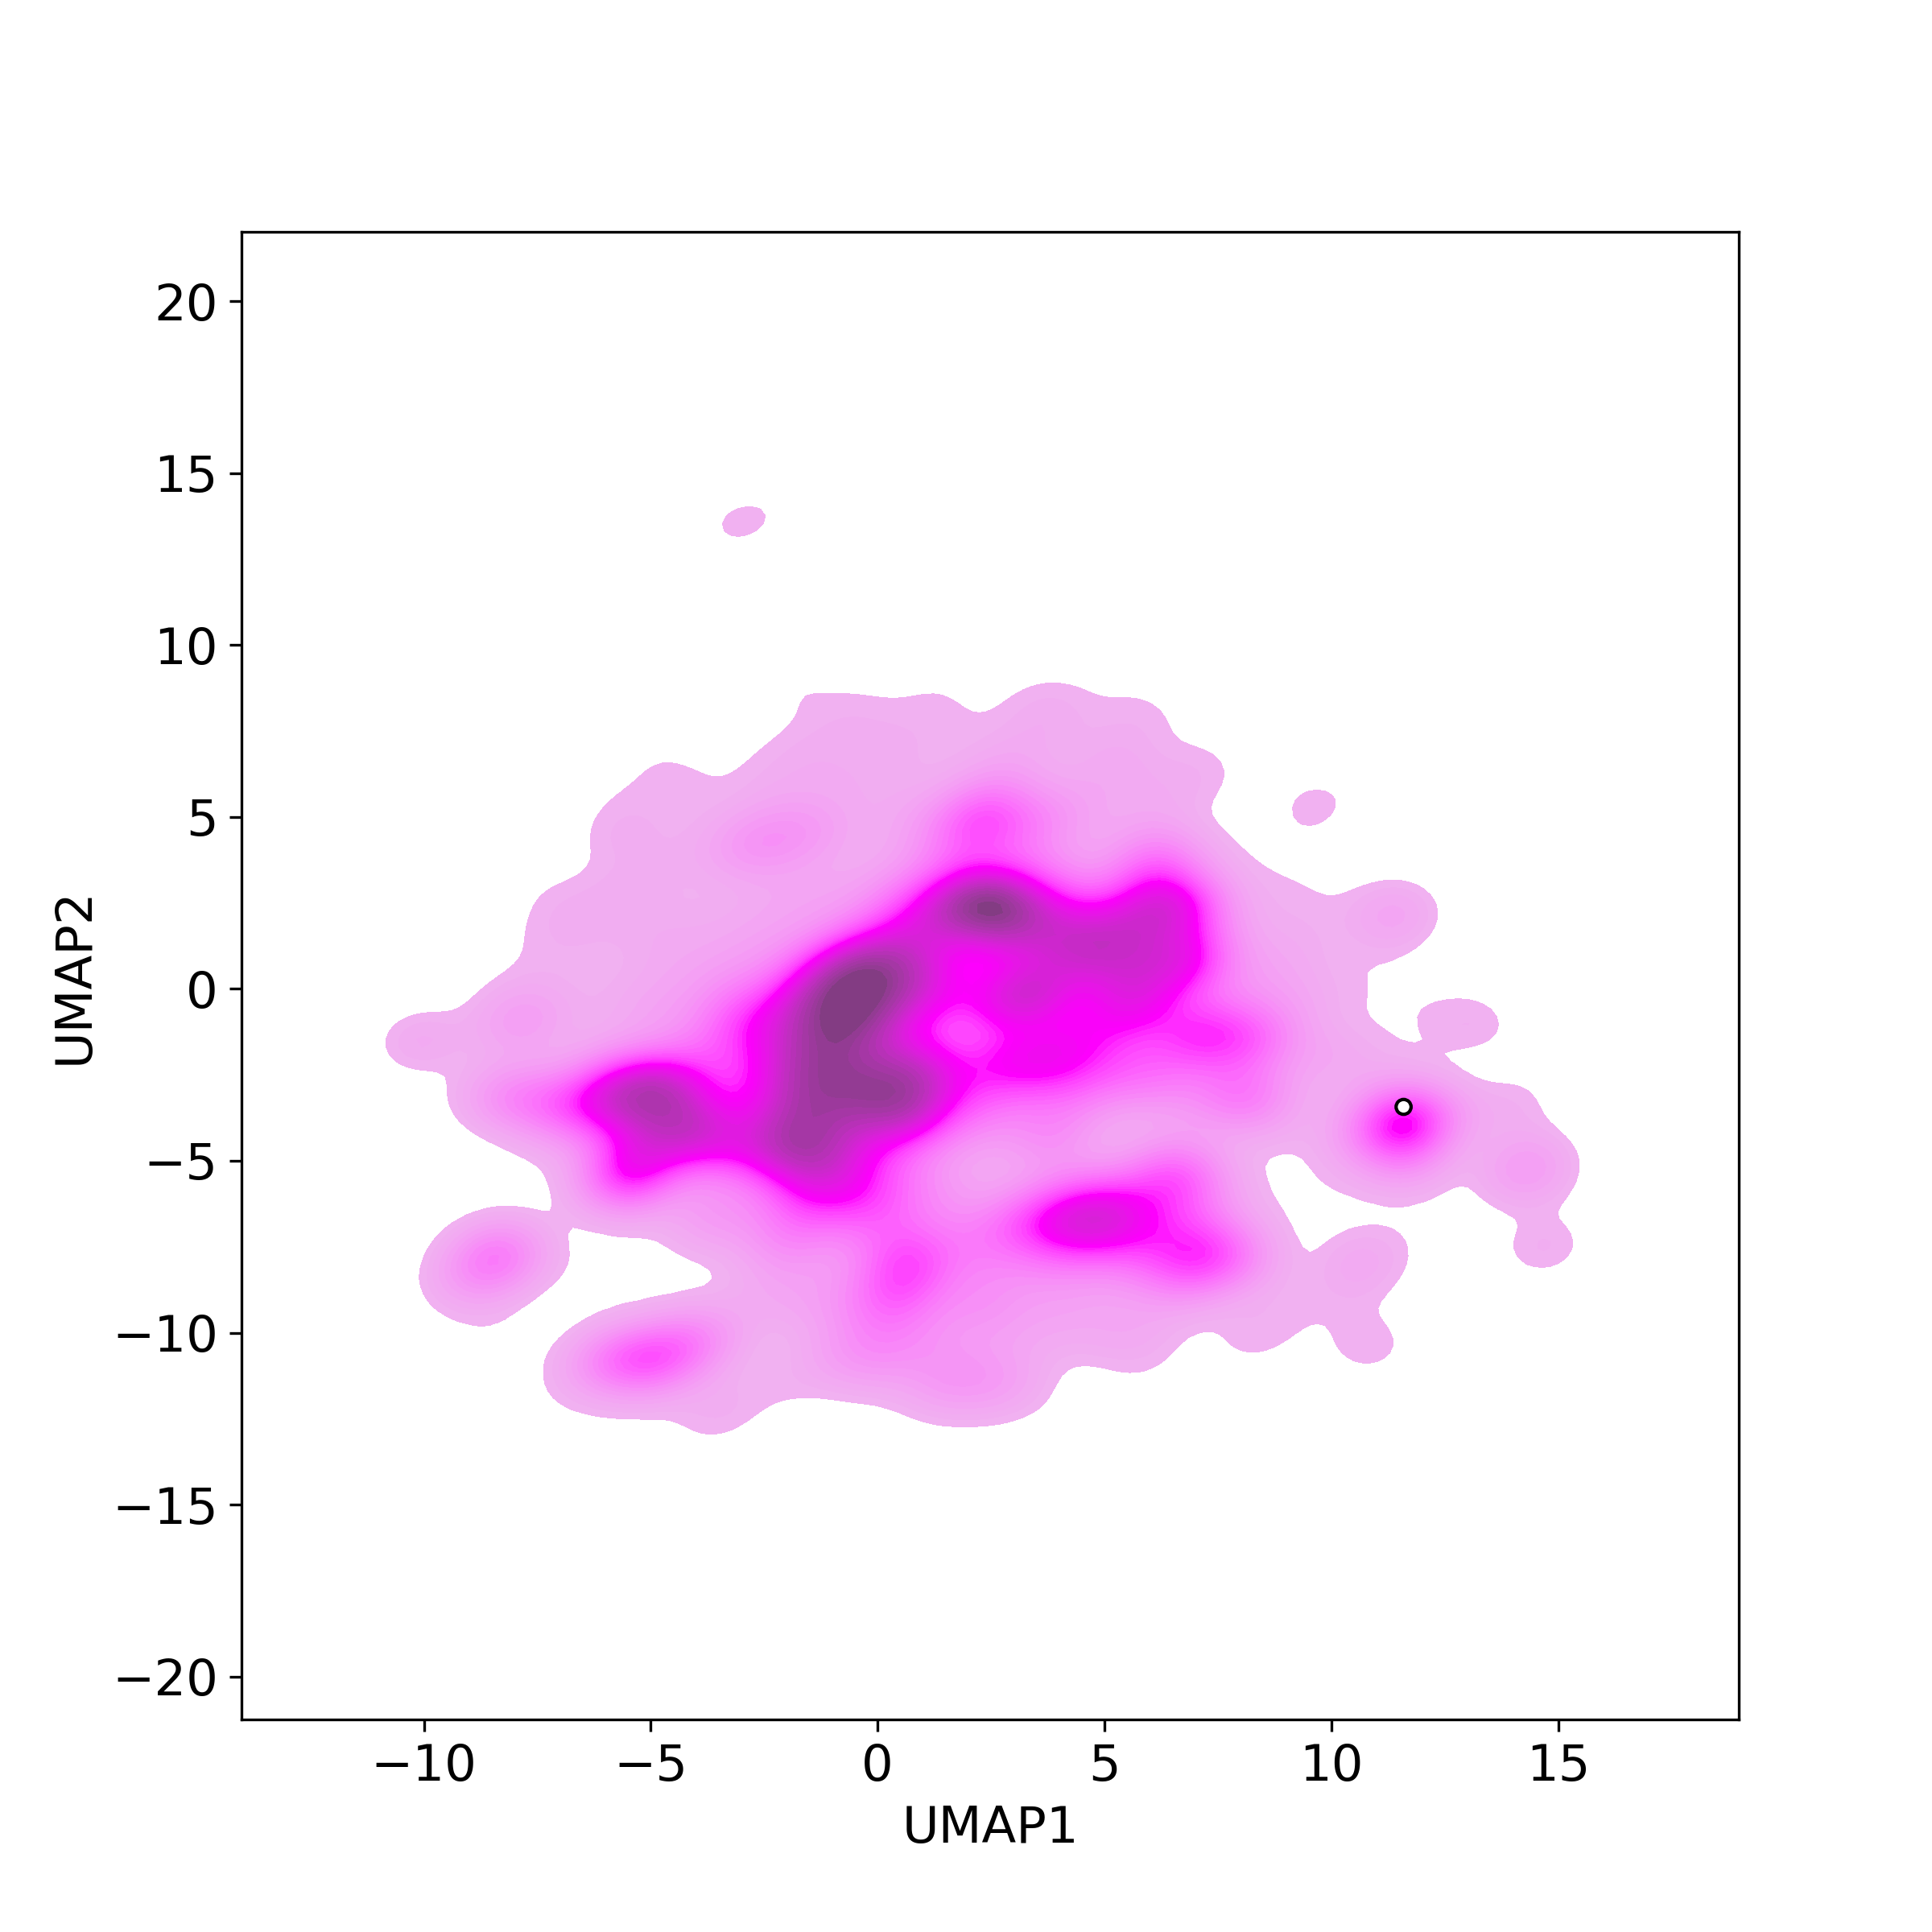
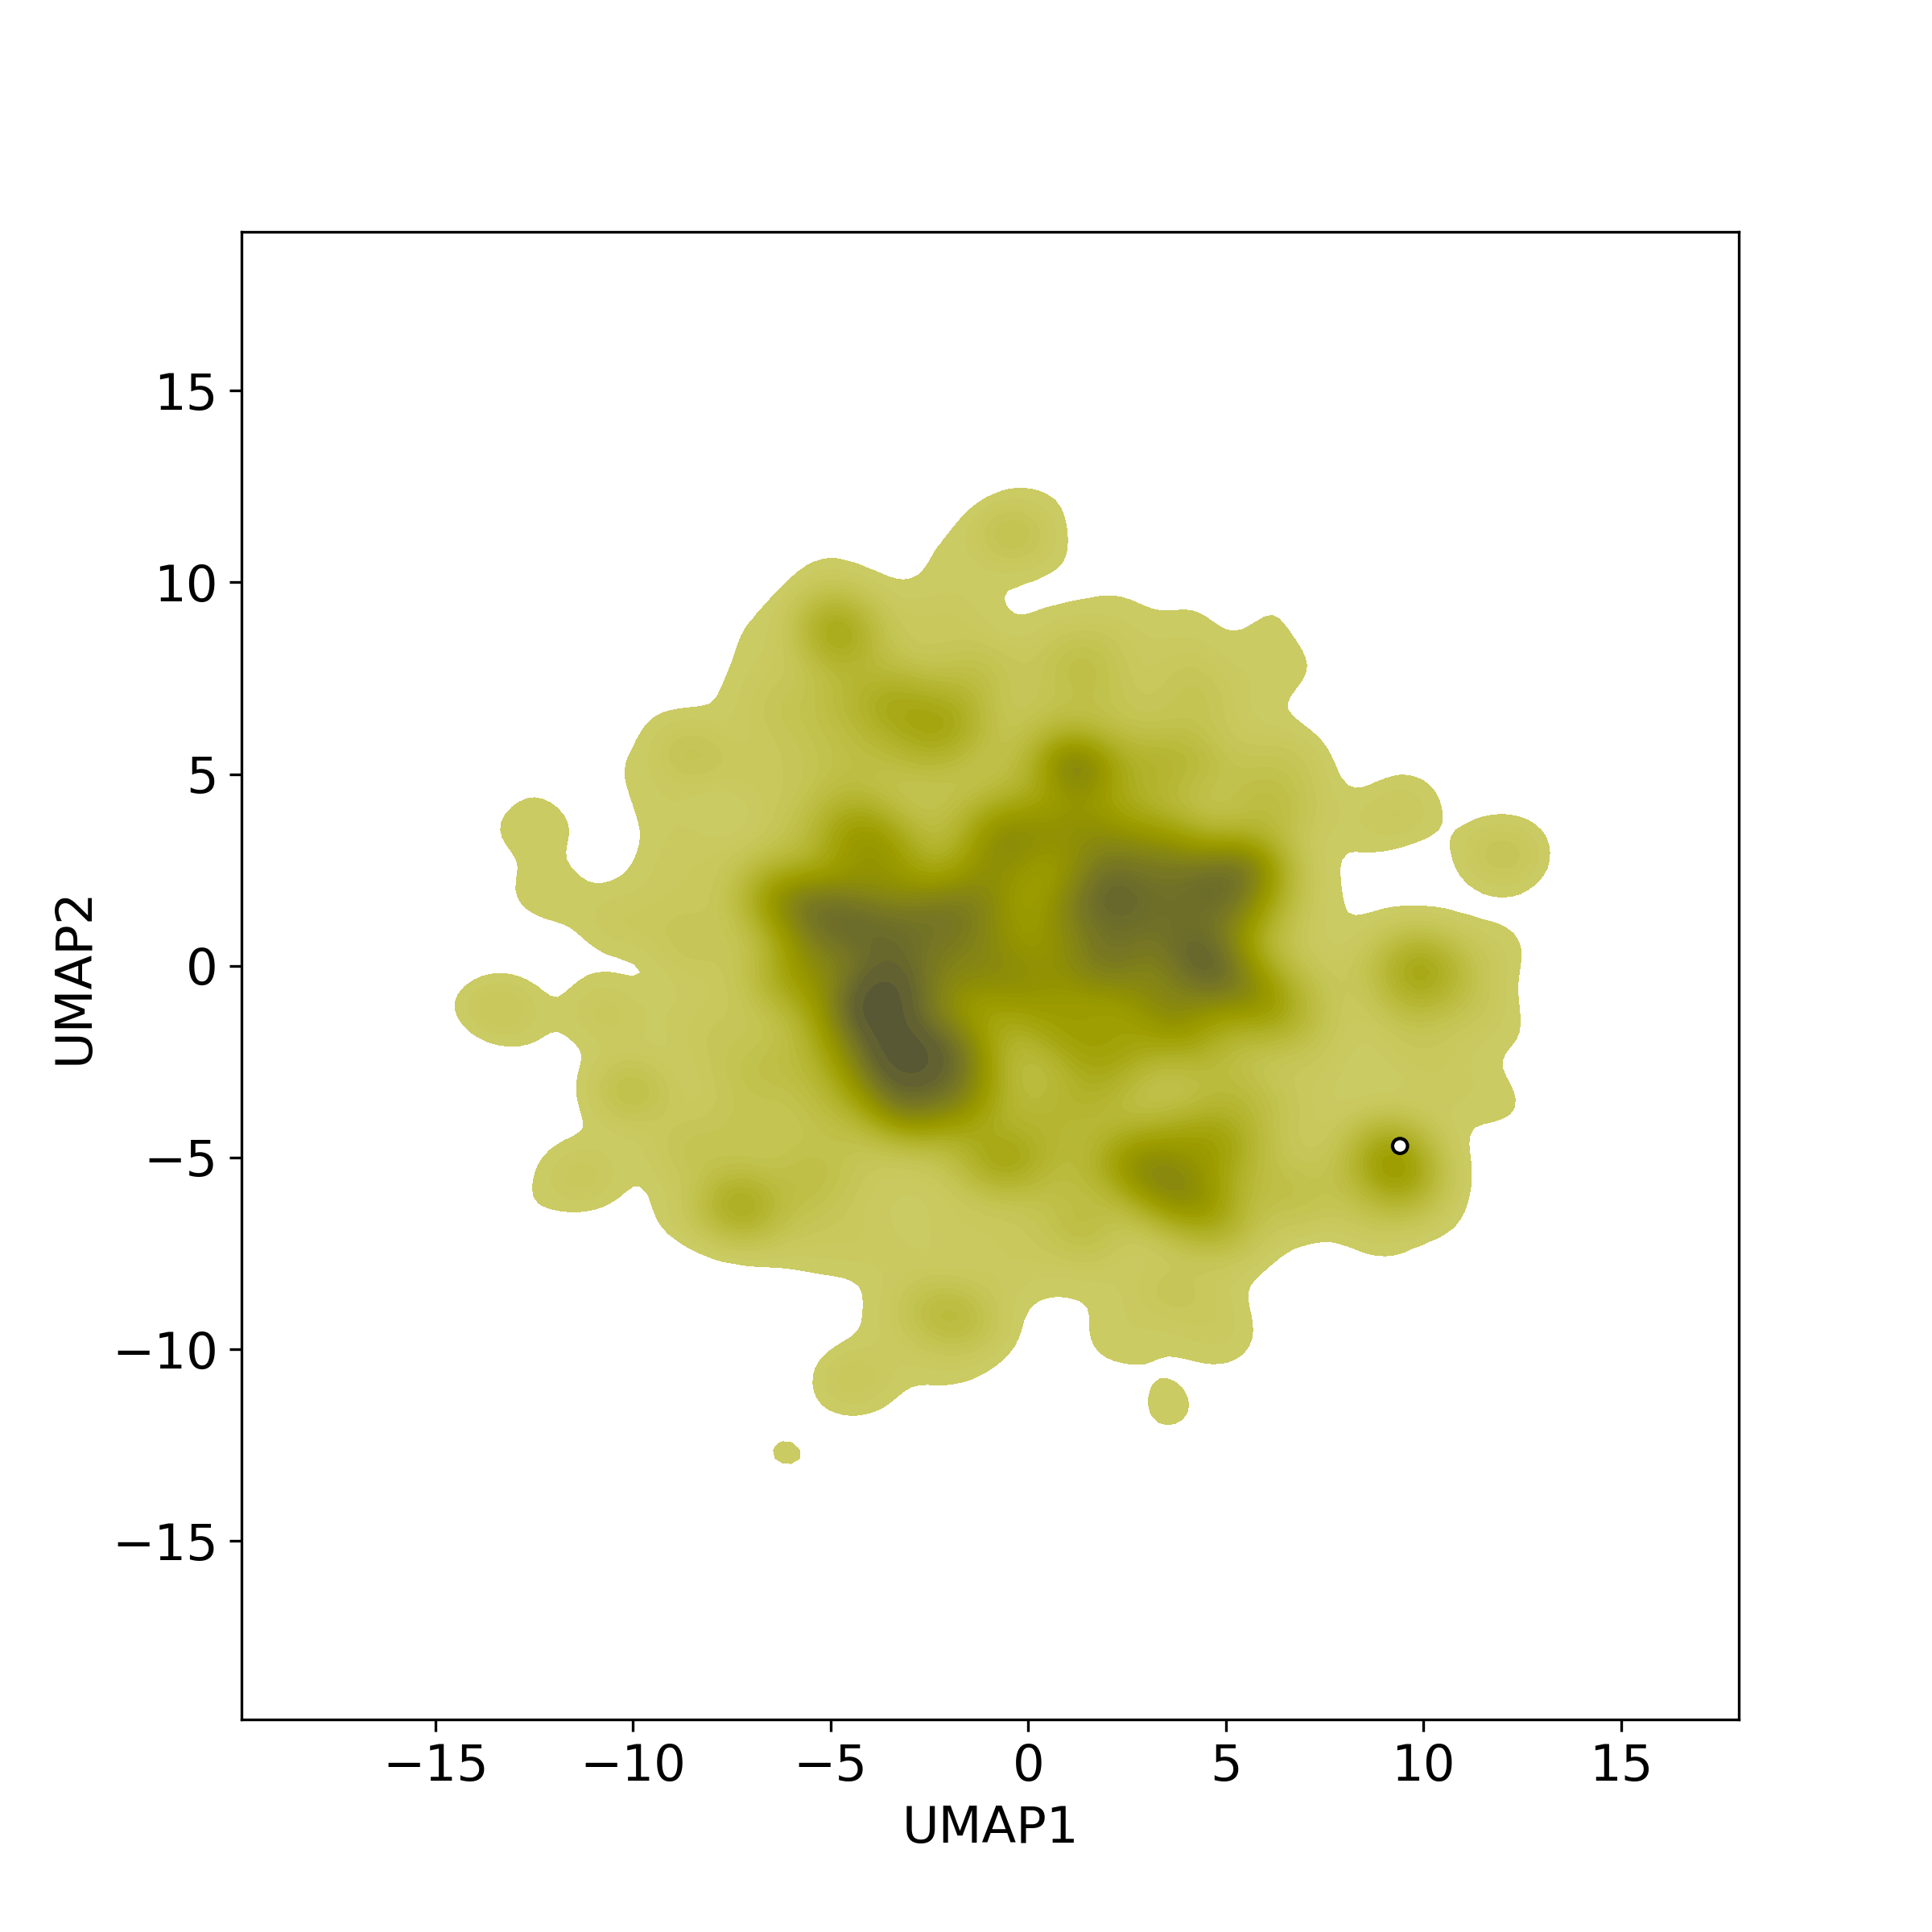
Similarity level is defined by Bioactivity similarity was calculated based on bioactivity descriptors of compounds. The bioactivity descriptors were calculated by a recently developed AI algorithm Chemical Checker (CC) [Nature Biotechnology, 38:1087–1096, 2020; Nature Communications, 12:3932, 2021], which evaluated bioactivity similarities at five levels:
☉ A: chemistry similarity;
☉ B: biological targets similarity;
☉ C: networks similarity;
☉ D: cell-based bioactivity similarity;
☉ E: similarity based on clinical data.
Those 5 categories of CC bioactivity descriptors were calculated and then subjected to manifold projection using UMAP algorithm, to project all NPs on a 2-Dimensional space. The current NP was highlighted with a small circle in the 2-D map. Below figures: left-to-right, A-to-E.