1.BROWSE THE TCM-ID
Users can browse the TCM-ID by clicking “Browse” on the top or “BROWSE DATABASE” at the bottom in the homepage, a new webpage will show up for browsing.

1.1 Browse Prescription by Record Source
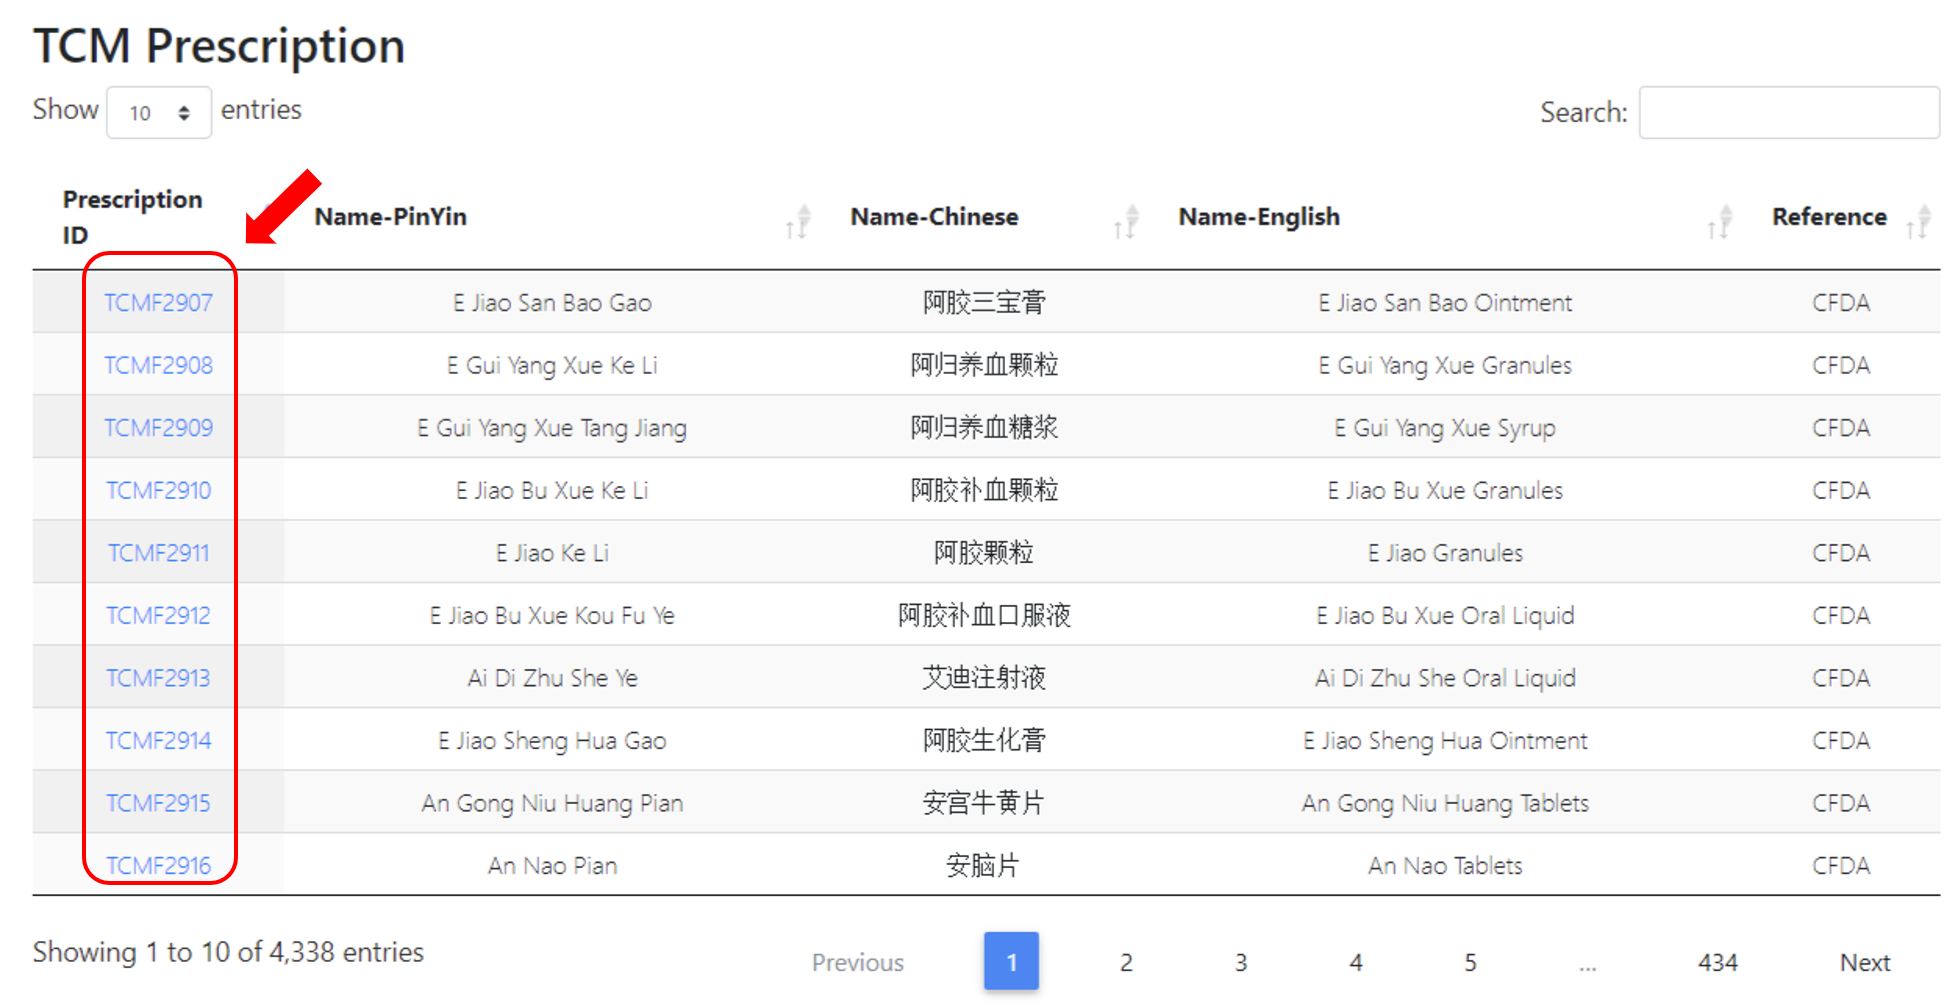
Total 7,443 TCM prescriptions were included in current TCM-ID. These prescription were mainly obtained from CFDA, Chinese Pharmacopoeia, Chinese Classical TCM Prescriptions, and TCM in Japanese Kampo. Users can browse all prescriptions via clicking “Browse All 7,443 TCM Prescription”, and access the prescriptions under different record sources by clicking corresponding icons.

After clicking specific ions, users will be redirected to a new webpage, as was shown in below.
1.2 Browse Prescription by Disease Category
366 ICD11 (International Classification of Diseases 11th Revision, https://icd.who.int/en/) codes for 4,601 prescriptions in current TCM-ID. Users can browse the ICD11 ID, corresponding English and Chinese name.
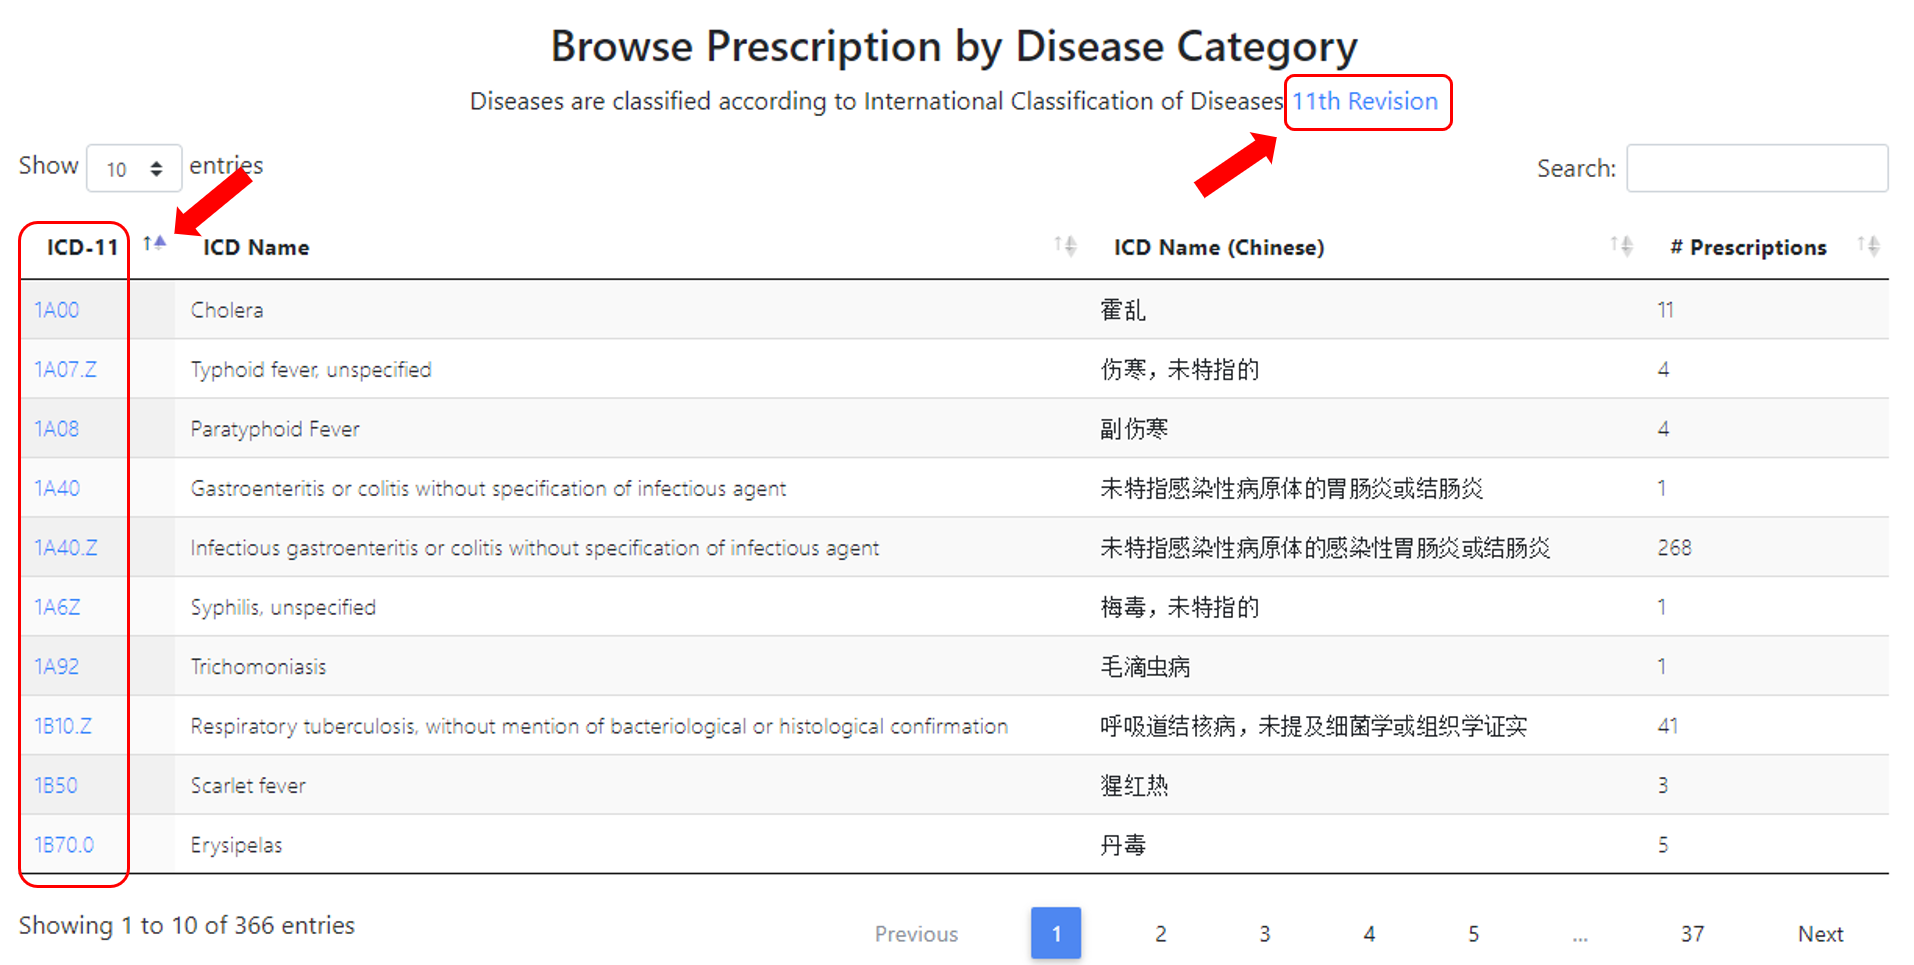
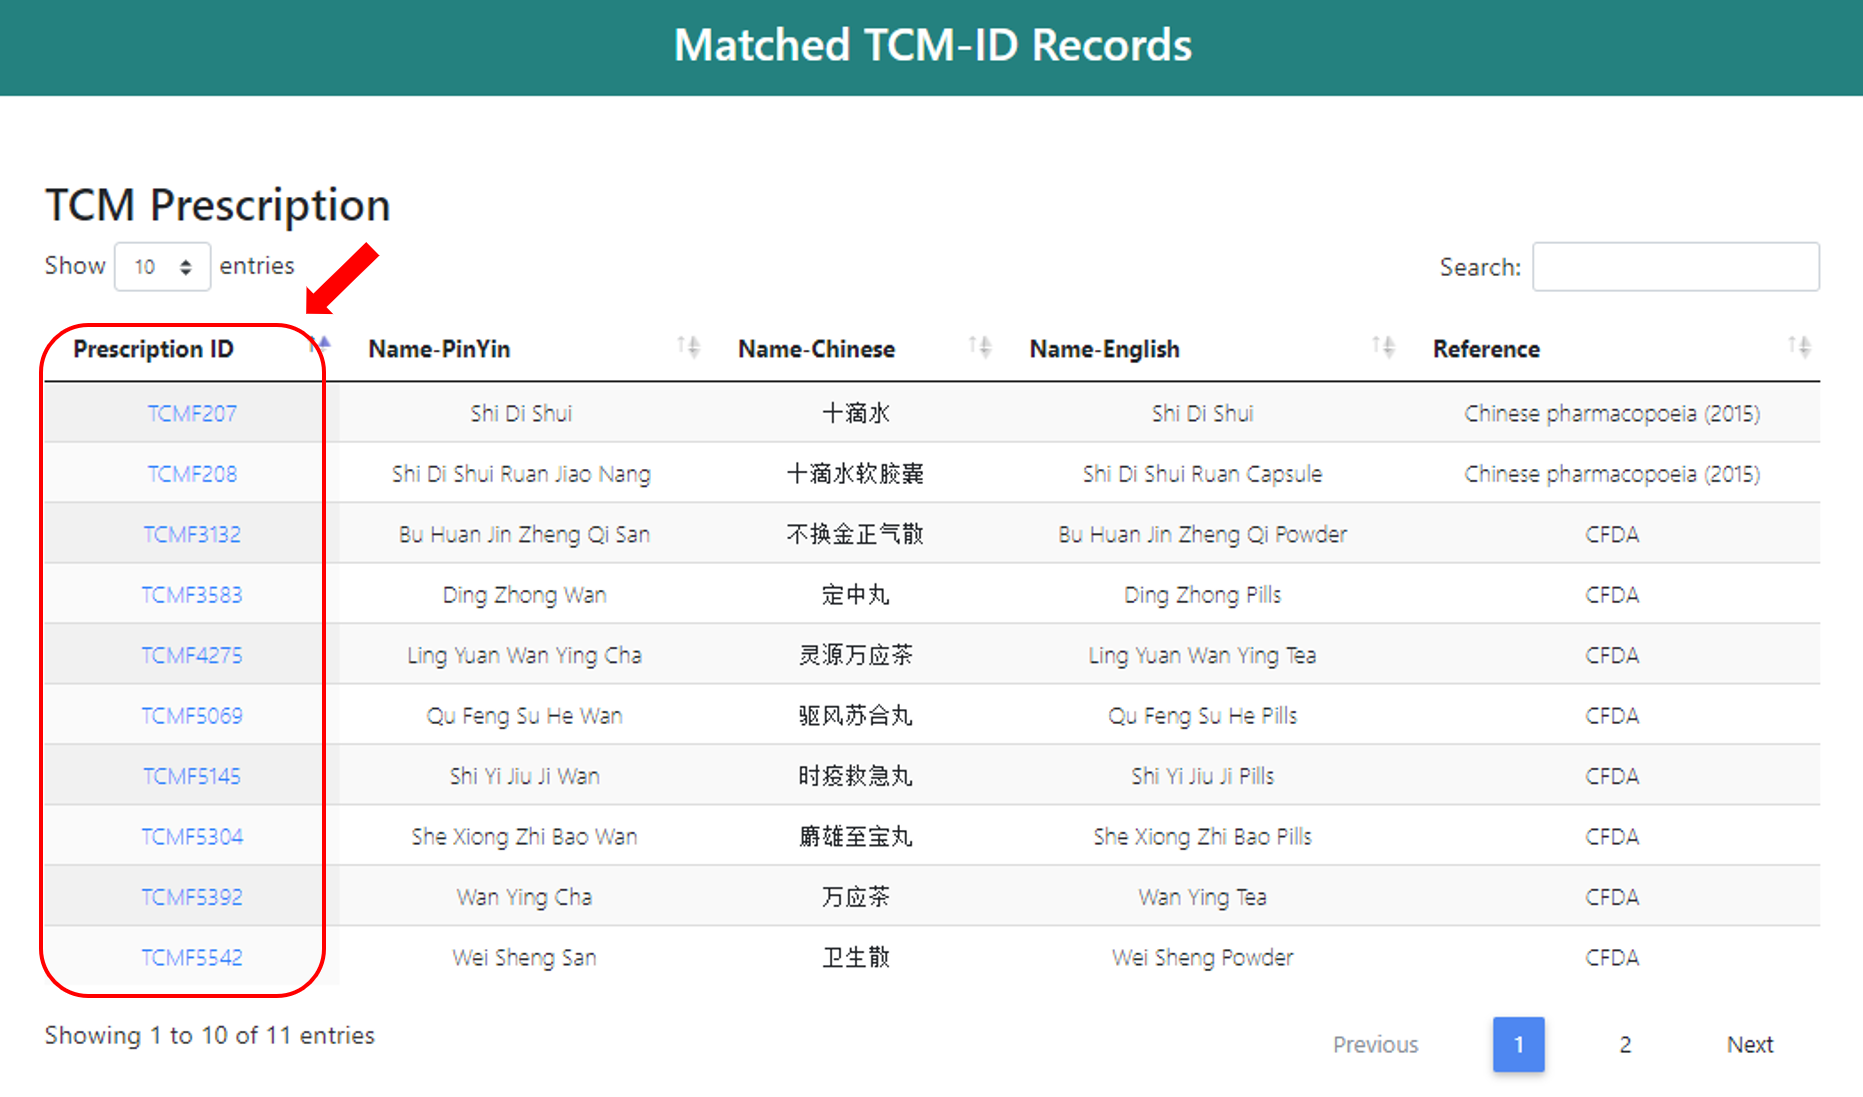
Users will be redirected to a new webpage to browse the Prescriptions related to the specific diseases via clicking the ICD11 ID.
1.3 Browse Components by Functional Class
Currently, there are 153 functional classes, users can view the prescriptions by clicking the name under “Functional class” column. And the corresponding herbs will show up.

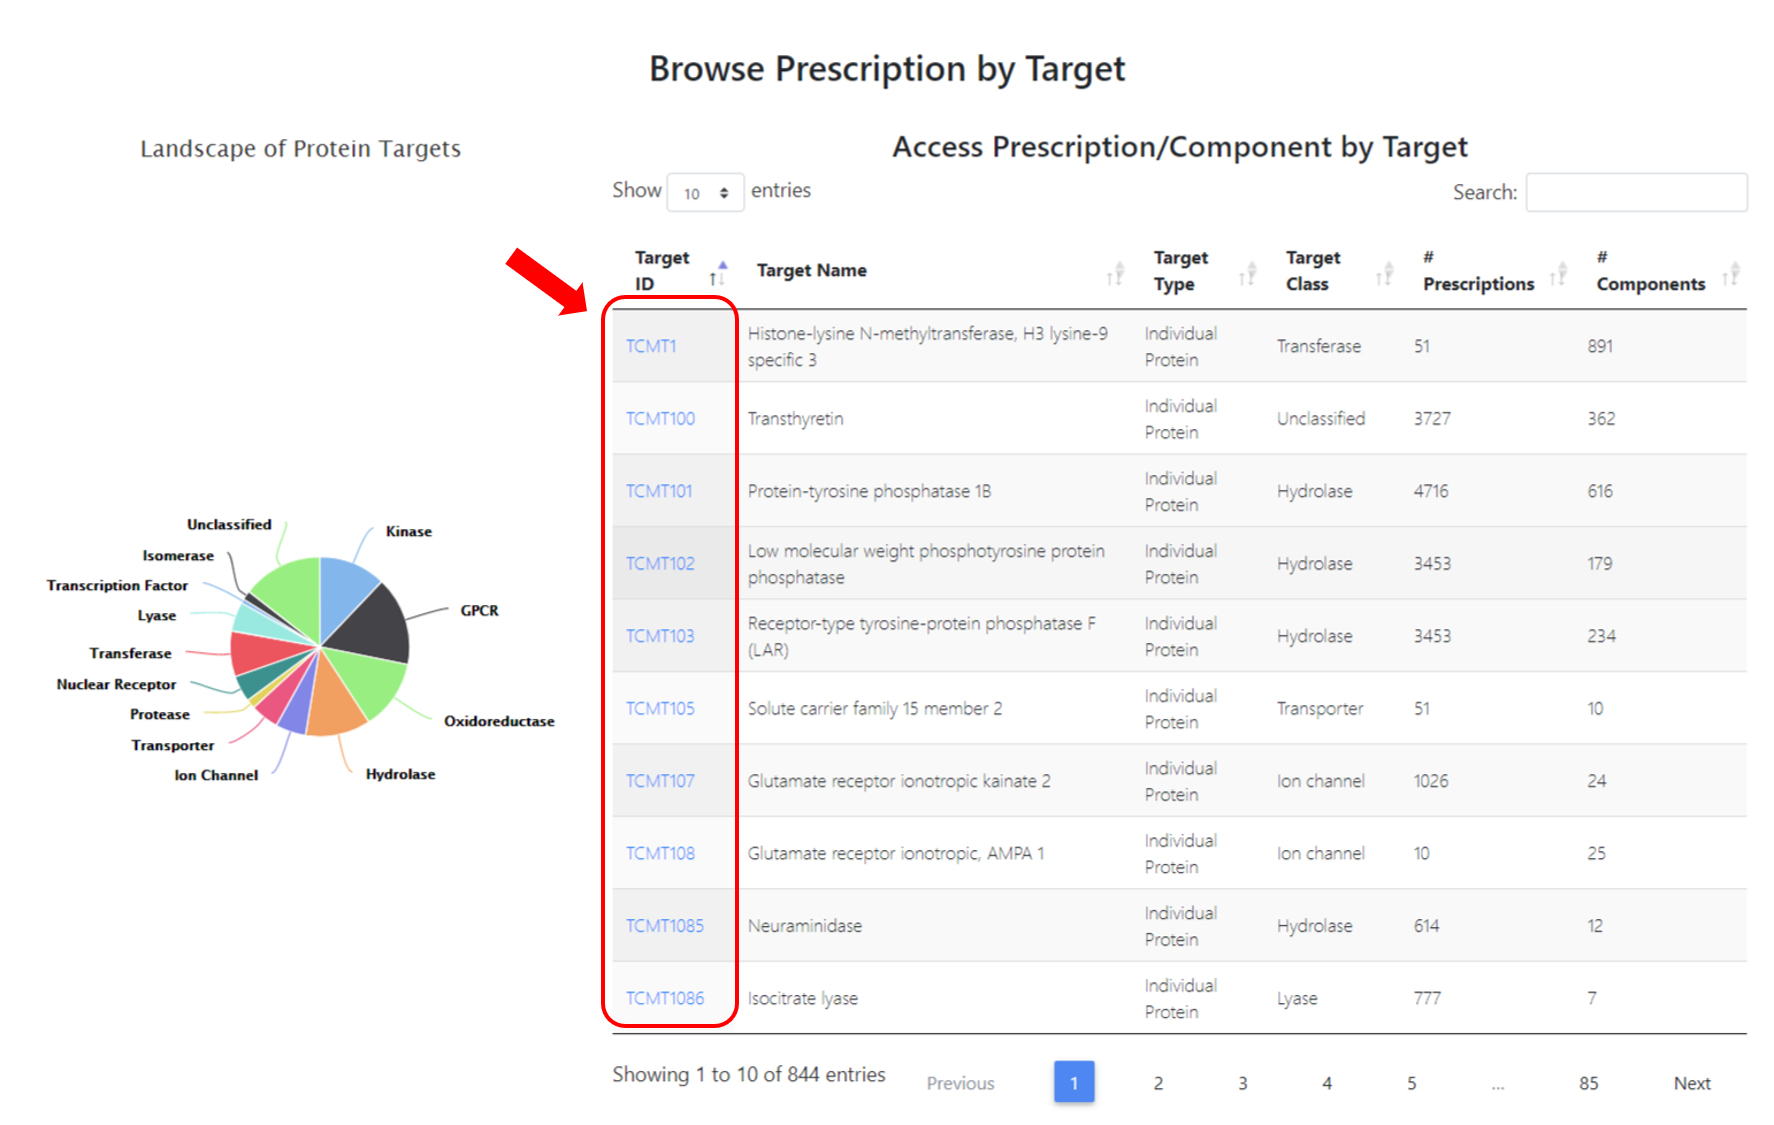
1.4 Browse Prescription by Target
Users can browse the 768 targets from this section, and a new webpage of target related prescriptions will show up when you click the entry under "Target ID" column.
2. SEARCH BY KEYWORDS
Users can search the TCM-ID from our homepage via tying in keywords under the “Keyword Search” covered four sections: “Search Prescription”, “Search Component”, “Search Target”, ”Search Disease”. Alternatively, by clicking the “Search” on the top or “ADVANCED SEARCH” at the bottom of the webpage, an advanced search webpage will be redirected.
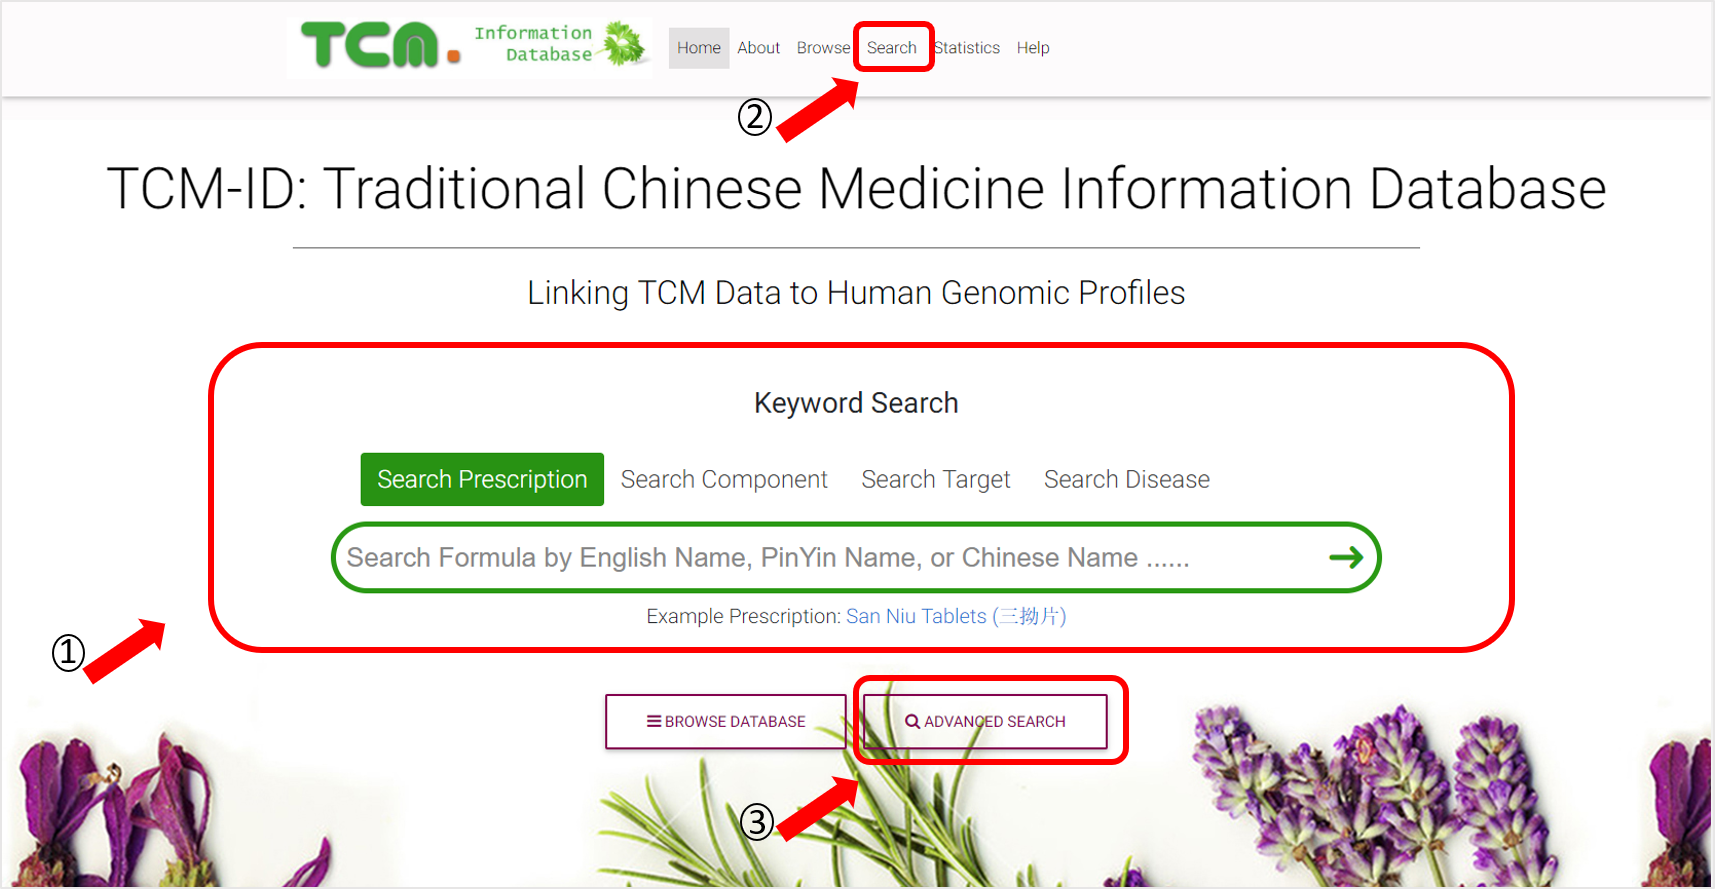
Four types of search functions were provided, users can type in keywords or click on the drop-down menus of "Select Prescription functions", "Select Disease ICD11 Codes","Reference" in the section of "Search TCM Prescription". The method to search of other three sections are similar.

3. WEBPAGE OF COMPONENT
A. Component General Information
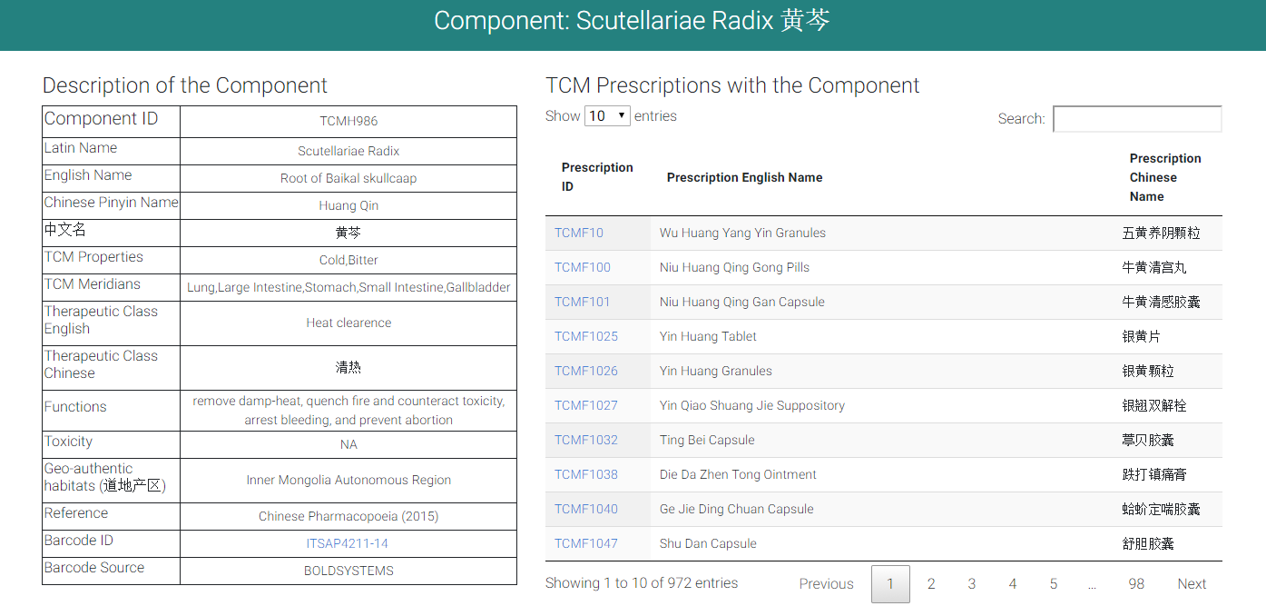
Component general information including Latin name, English name, Chinese name, Pinyin name, TCM properties, TCM Meridians, Therapeutic class in English and Chinese, Functions, and toxicity was listed. Furthermore, Geo-authentic habitats, plant DNA barcode ID were provided if any. External link to original source of Barcode information was also offered if available.
B. Putative targets of Component
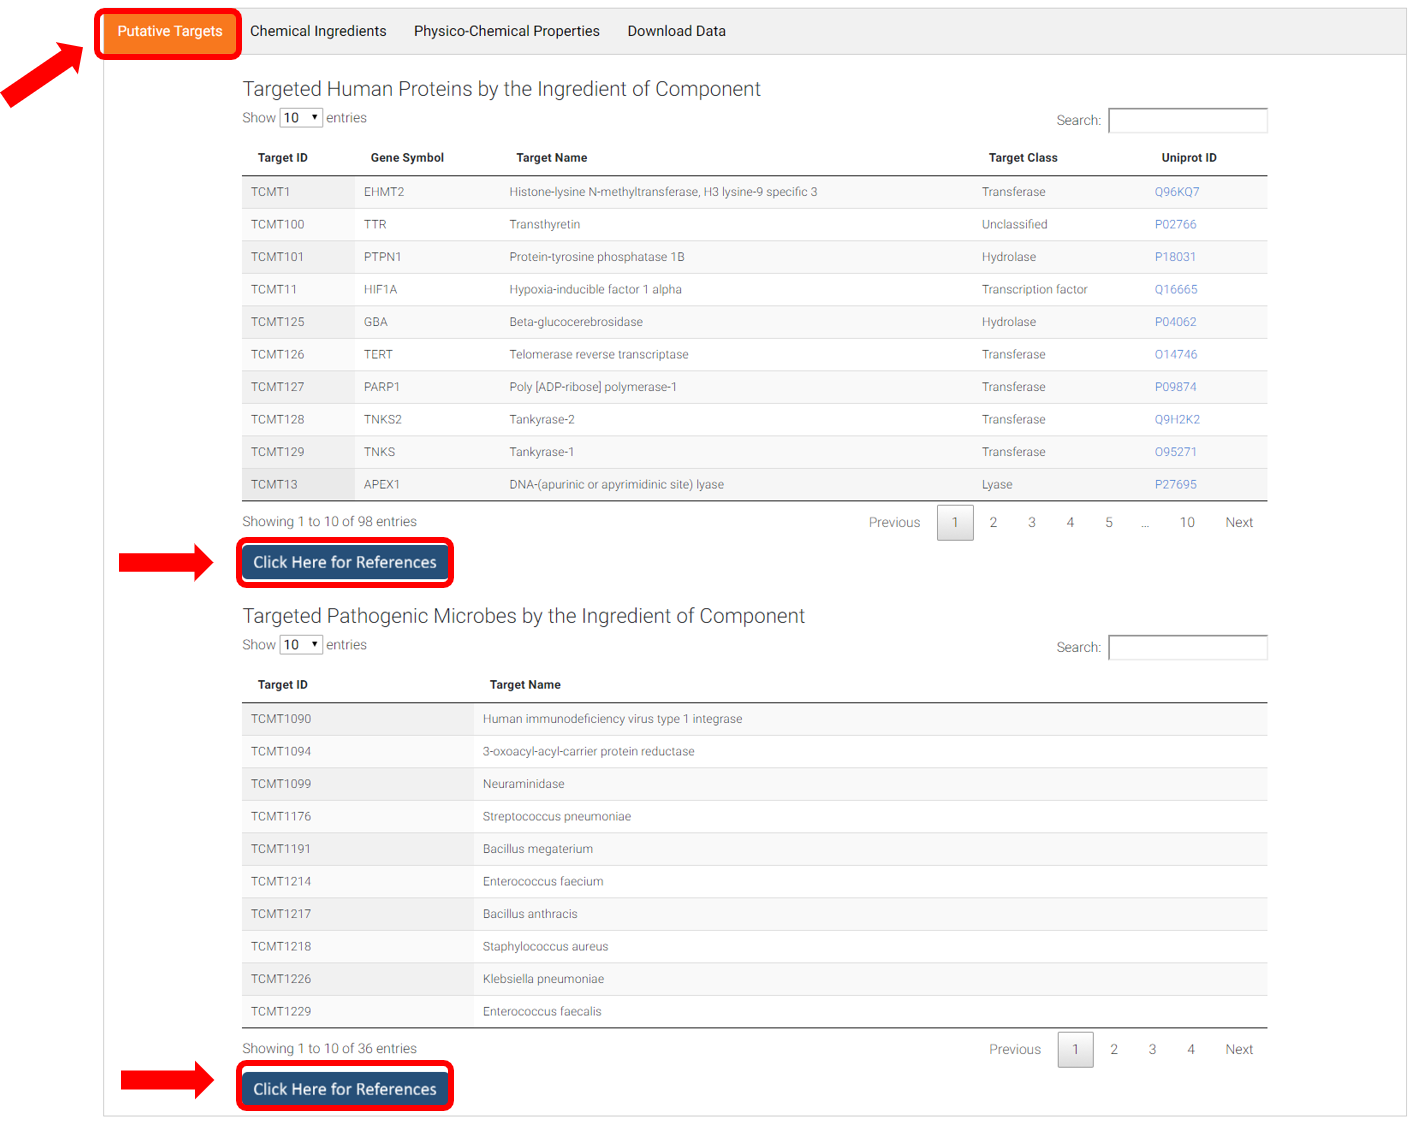
Targeted human proteins of component (<=10uM) and targeted pathogenic microbes of component (<=100uM) were listed, with external link to Uniprot to view target details. Click "Click Here for Reference" to view activity values. References are linked to referred publications via PubMed ID or DOI.

C. Structural information of Component
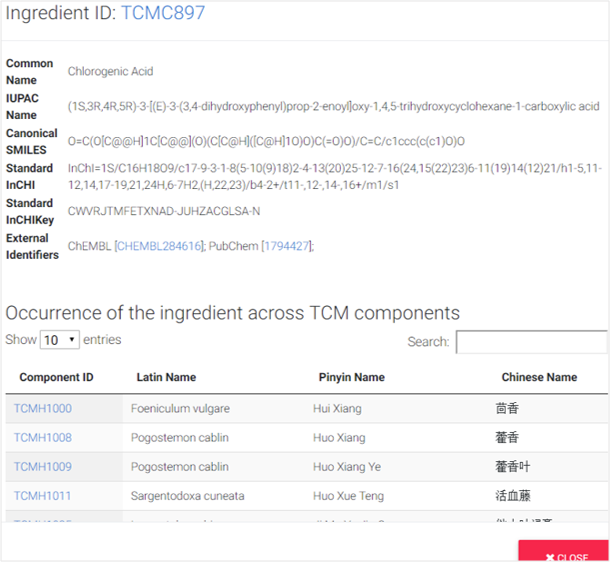
2D structures of component ingredients were provided. After clicking “SEE DETAILS” under each of 2D structure card, details of ingredients were listed, including common name, IUPAC name, Canonical SMILES, Standard InCHI, Standard InCHIKey. Occurrence of the ingredient across TCM components were also provided.

D. Physico-Chemical Properties
By clicking “Physico-Chemical Properties”, a table of 13 properties of all ingredients of the component will show up, including formula, molecular name, molecular weight, AlogP, MlogP, XlogP, No. of hydrogen bond accepter, No. of hydrogen bond donor, polar surface area, No. of rotational bond, No. of rings, No. of heavy atoms, and Lipinski role of 5 violation.

4. WEBPAGE OF PUTATIVE TARGETS OF PRESCRIPTION
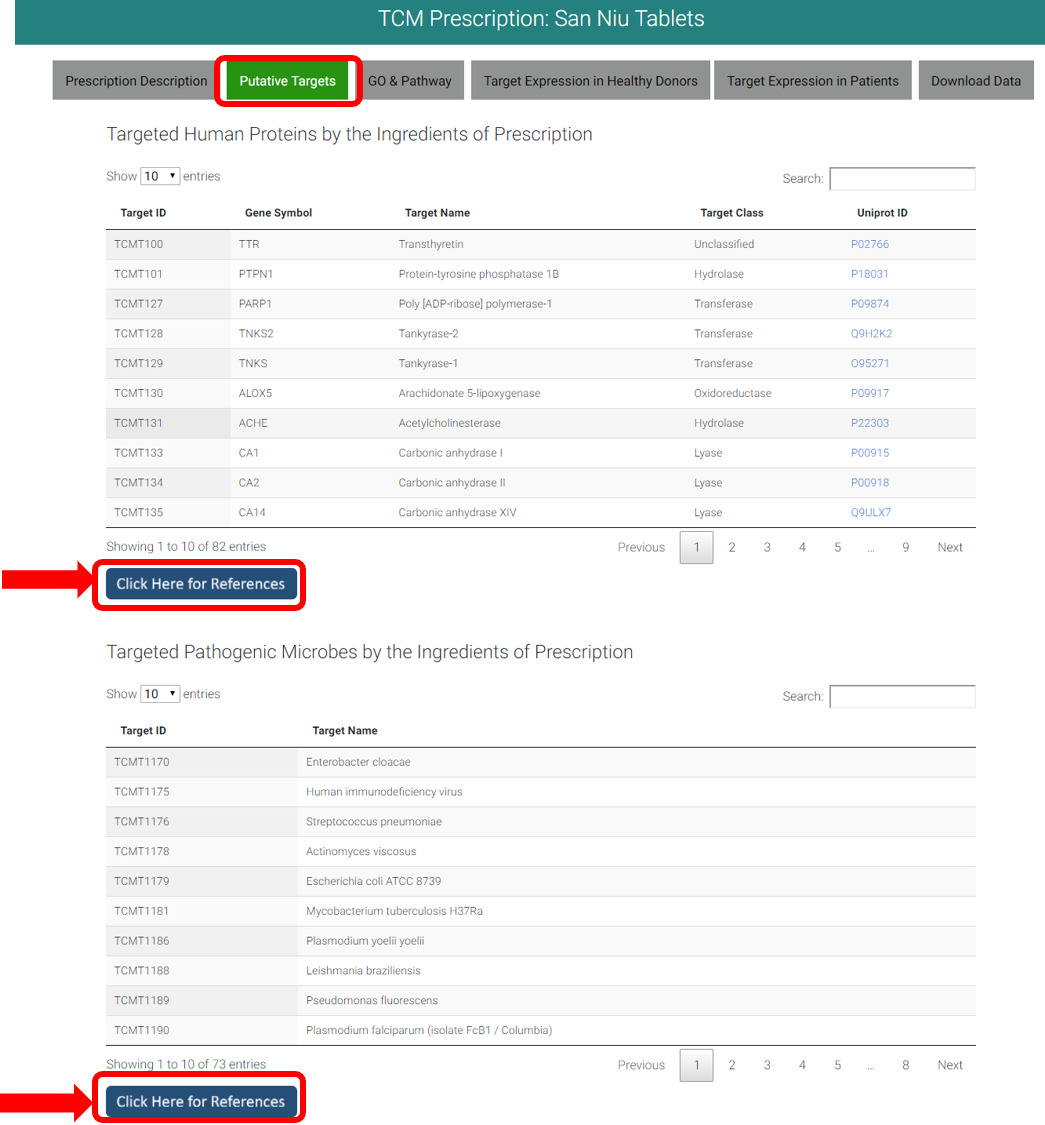
Targeted human proteins by the ingredients (<=10uM) of prescription and targeted pathogenic microbes by the ingredients (<=100uM or 100ug/ml) of prescription were listed, with external link to Uniprot to view target details. Click "Click Here for Reference" to view activity values. References are linked to referred publications via PubMed ID or DOI.
5. WEBPAGE OF GO TERM&KEGG PATHWAY
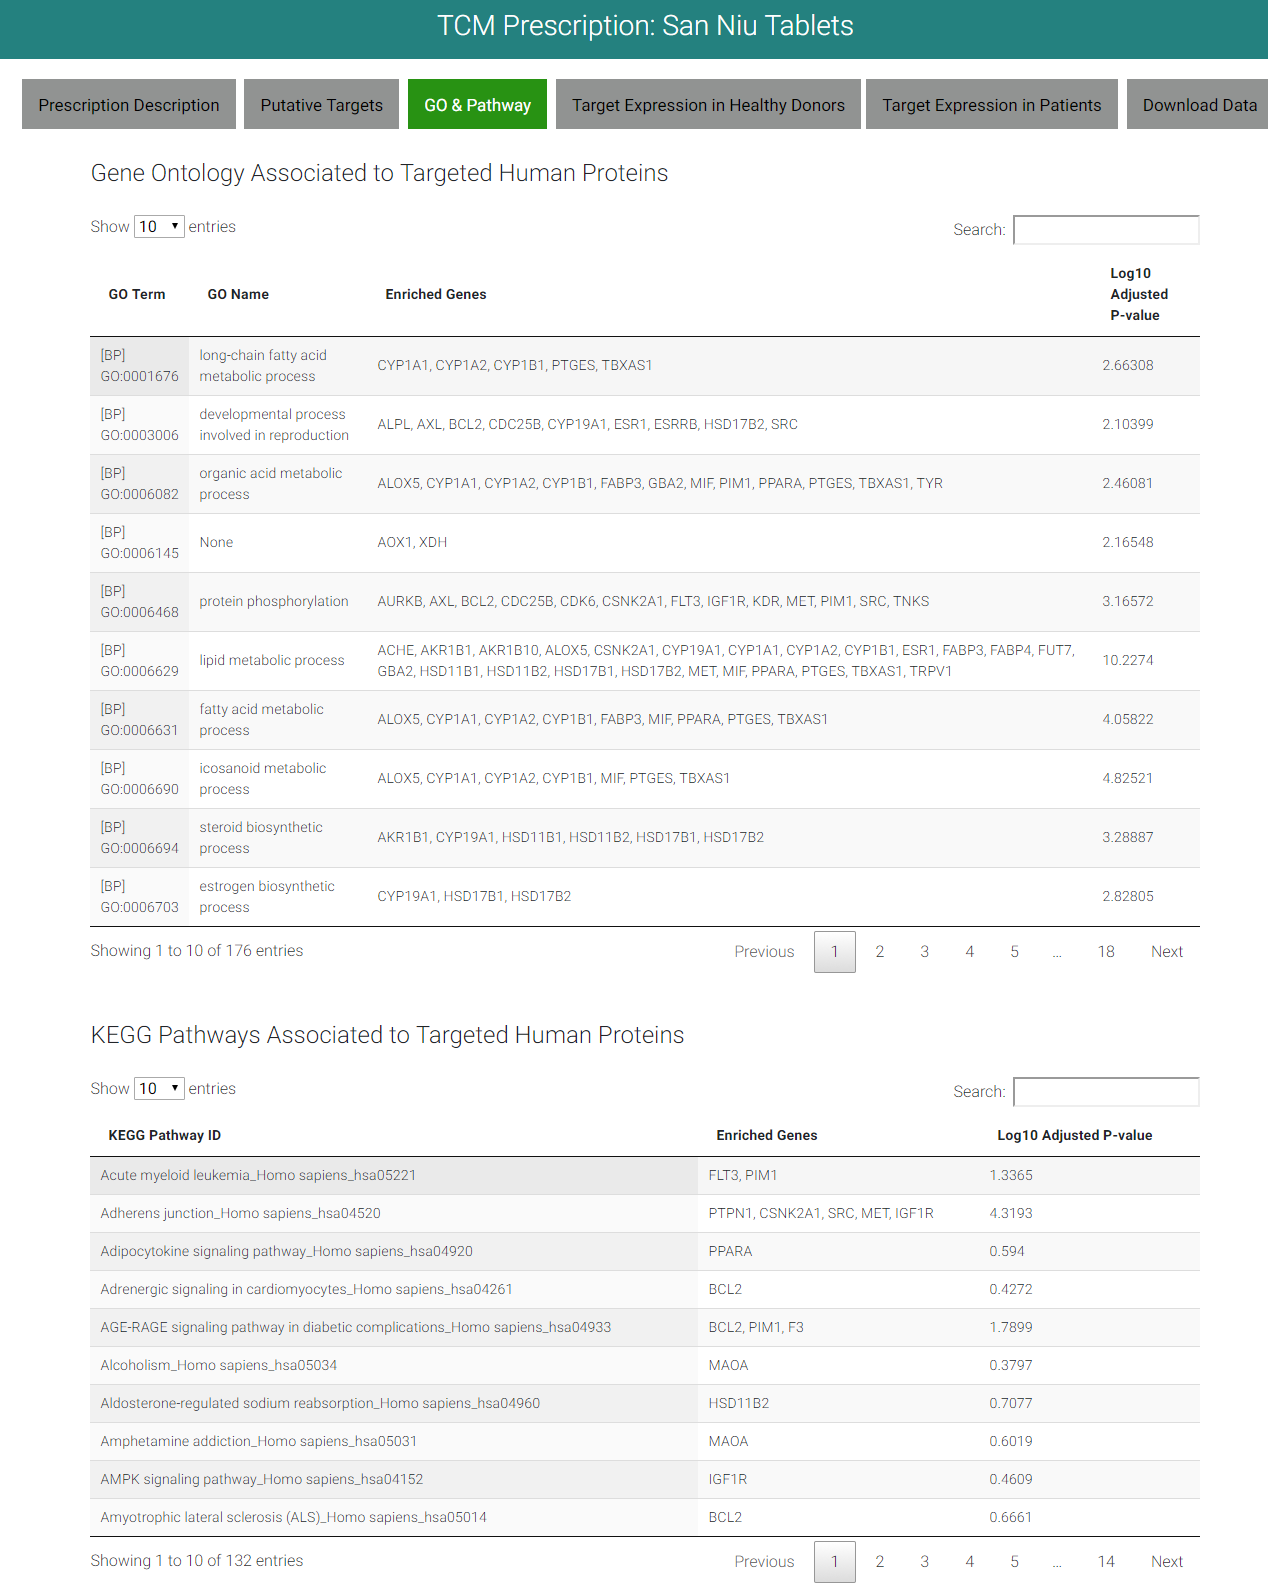
Gene Ontology (GO) term and KEGG pathways were used to enrich human protein targets of prescriptions.
6. LANDSCAPE OF TARGET EXPRESSION IN HEALTHY HUMAN SAMPLES
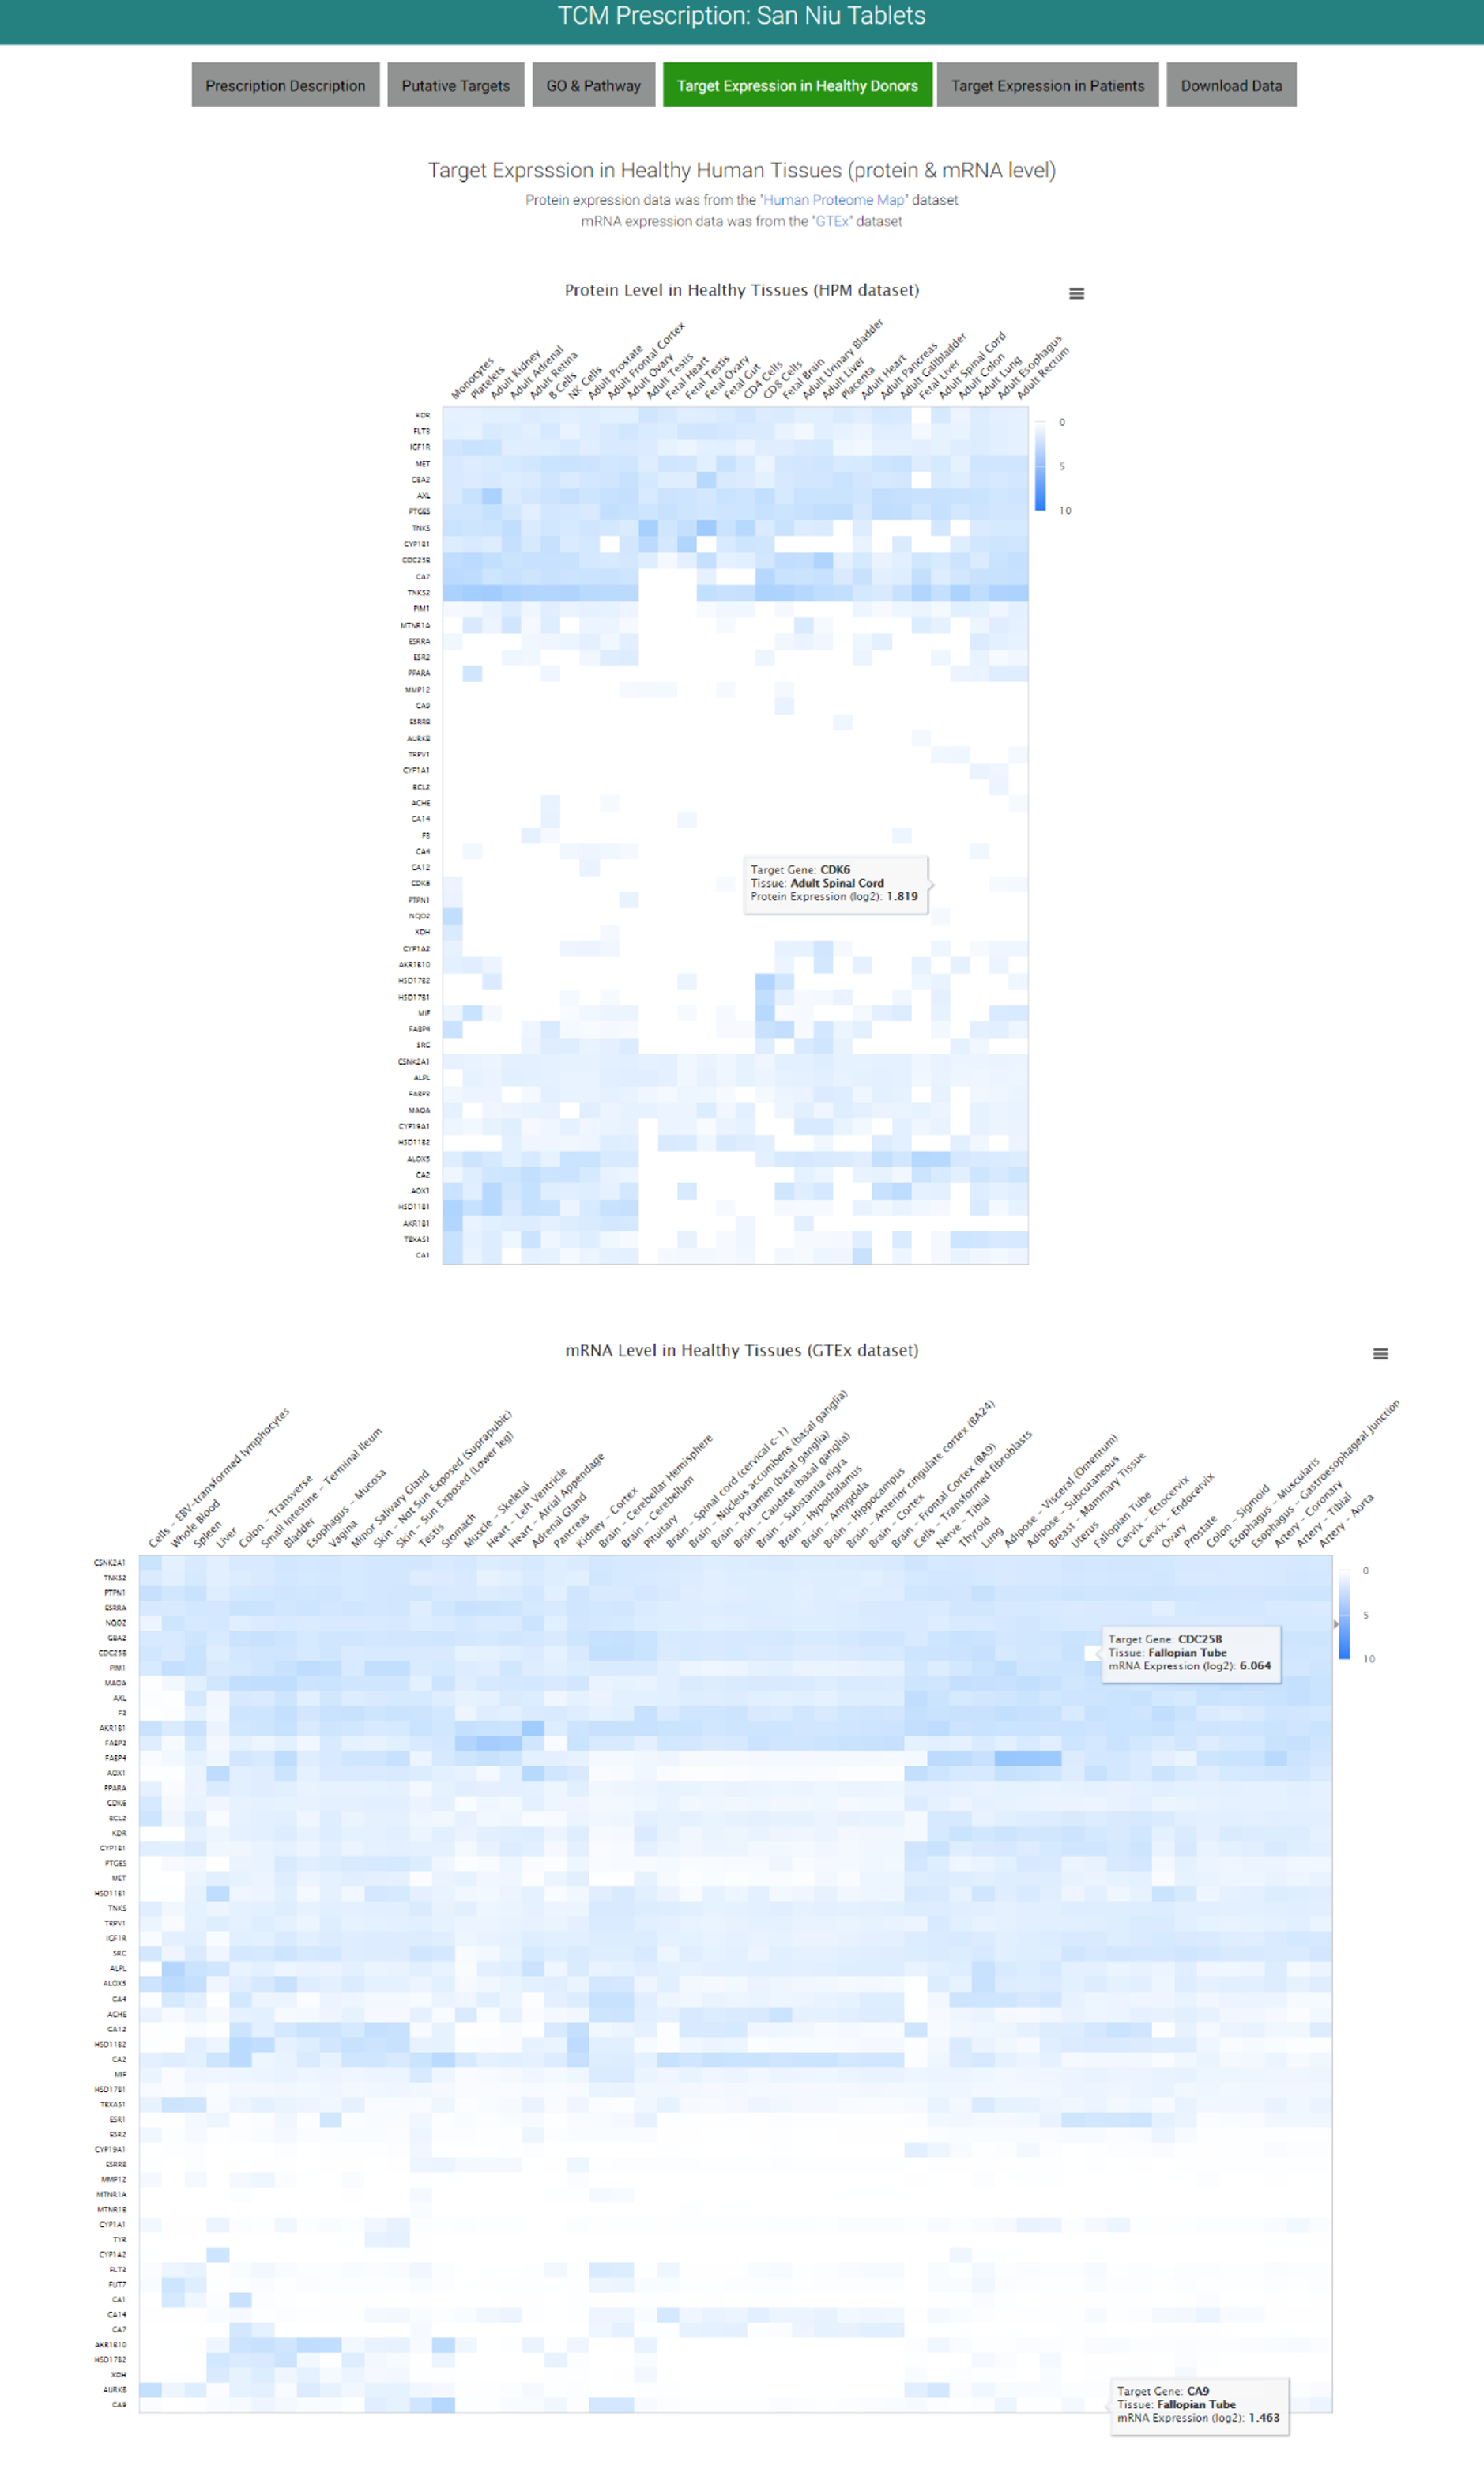
Target expression (log2) in healthy human tissues (protein & mRNA level) of 3,286 prescriptions was provided by generating heatmap, log2(expression value) will show up when placing mouse arrow over each cell of the heatmap.
7. LANDSCAPE OF TARGET EXPRESSION IN PATIENTS
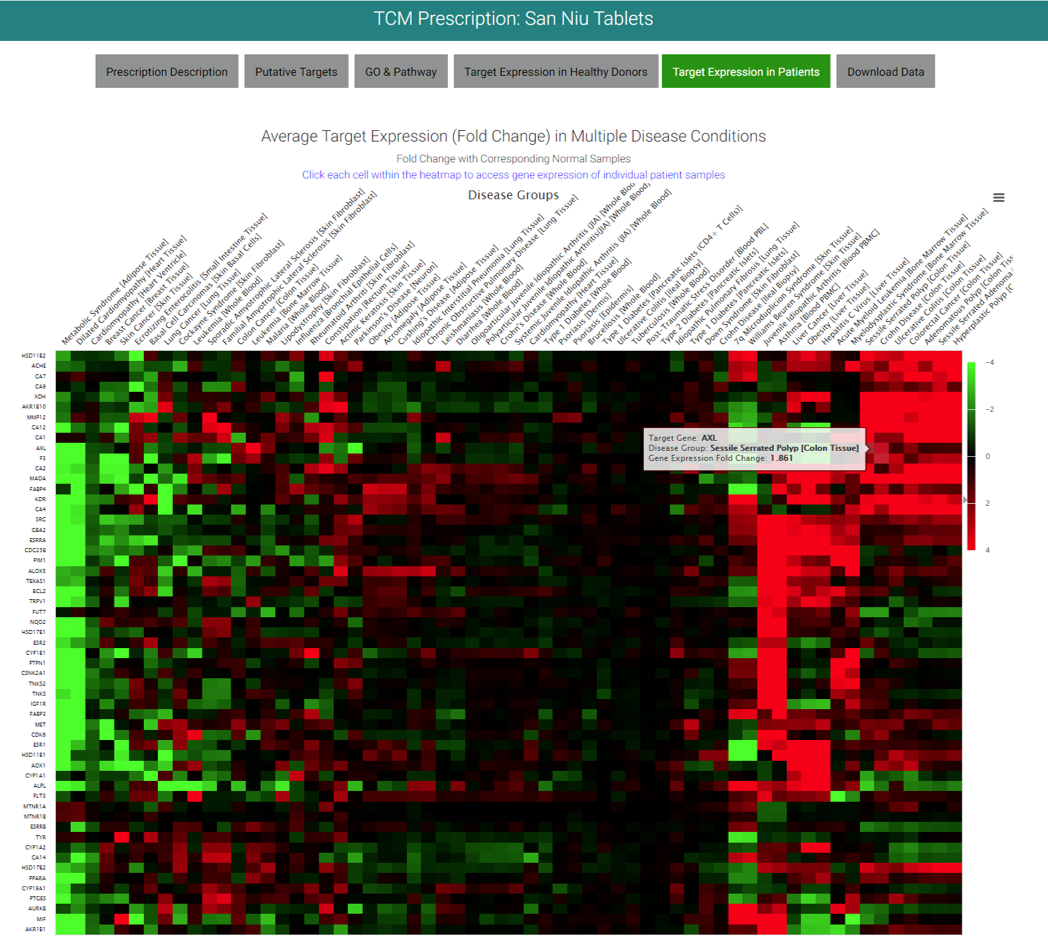
Average target expression (Fold Change) heatmaps in multiple 56 disease conditions of 3,286 prescriptions were provided, they will tell the difference expression of up-regulated and down-regulated genes, which represented by red and green color, respectively. Log2 (fold change) will show up when placing mouse arrow over each cell of the heatmap. Users can click each cell within the heatmap to access gene expression of individual patient samples.
8. GENE EXPRESSION OF INDIVIDUAL PATIENT SAMPLES
Median gene expression of individual patient and healthy samples was provided by Violin Plot, generated by R package “ggstatsplot”. Statistics and No. of samples were provided. External link to patient sample information from GEO/GTEx was also listed below the violin plot.

9. DOWNLOAD DATA
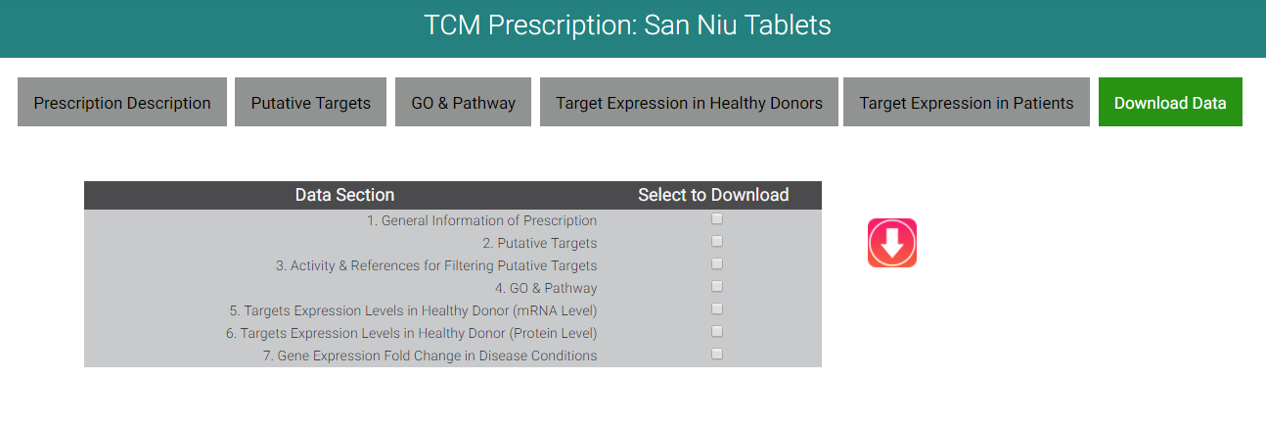
Users can click "Download Data" to downlaod the information you need.
