*Note: the InCHIKey will be temporarily assigned as the "Common Name" if no IUPAC name or alternative short name is available.
**Note: the Chemical Classification was calculated by NPClassifier Version 1.5. Reference: PMID:34662515.
| Organism ID | Organism Name | Taxonomy Level | Family | SuperKingdom | Isolation Part | Collection Location | Collection Time | Reference |
|---|
☑ Note for Reference:
In addition to directly collecting NP source organism data from primary literature (where reference will provided as NCBI PMID or DOI links), NPASS also integrated them from below databases:
☉ UNPD: Universal Natural Products Database [PMID: 23638153].
☉ StreptomeDB: a database of streptomycetes natural products [PMID: 33051671].
☉ TM-MC: a database of medicinal materials and chemical compounds in Northeast Asian traditional medicine [PMID: 26156871].
☉ TCM@Taiwan: a Traditional Chinese Medicine database [PMID: 21253603].
☉ TCMID: a Traditional Chinese Medicine database [PMID: 29106634].
☉ TCMSP: The traditional Chinese medicine systems pharmacology database and analysis platform [PMID: 24735618].
☉ HerDing: a herb recommendation system to treat diseases using genes and chemicals [PMID: 26980517].
☉ MetaboLights: a metabolomics database [PMID: 27010336].
☉ FooDB: a database of constituents, chemistry and biology of food species [www.foodb.ca].
| Organism ID | NP ID | Organism Material Preparation | Organism Part | NP Quantity (Standard) | NP Quantity (Minimum) | NP Quantity (Maximum) | Quantity Unit | Reference |
|---|
☑ Note for Reference:
In addition to directly collecting NP quantitative data from primary literature (where reference will provided as NCBI PMID or DOI links), NPASS also integrated NP quantitative records for specific NP domains (e.g., NPS from foods or herbs) from domain-specific databases. These databases include:
☉ DUKE: Dr. Duke's Phytochemical and Ethnobotanical Databases.
☉ PHENOL EXPLORER: is the first comprehensive database on polyphenol content in foods [PMID: 24103452], its homepage can be accessed at here.
☉ FooDB: a database of constituents, chemistry and biology of food species [www.foodb.ca].
| Target ID | Target Type | Target Name | Target Organism | Activity Type | Activity Relation | Value | Unit | Reference |
|---|---|---|---|---|---|---|---|---|
| NPT393 | Cell Line | HCT-116 | Homo sapiens | IC50 | = | 0.4 | nM | PMID[479218] |
| NPT3558 | Cell Line | QG-56 | IC50 | = | 5.5 | nM | PMID[479218] | |
| NPT397 | Cell Line | NCI-H460 | Homo sapiens | IC50 | = | 2.1 | nM | PMID[479218] |
| NPT579 | Cell Line | DLD-1 | Homo sapiens | IC50 | = | 0.6 | nM | PMID[479218] |
| NPT180 | Cell Line | HCT-8 | Homo sapiens | IC50 | = | 2.49 | nM | PMID[479219] |
| NPT181 | Cell Line | Bel-7402 | Homo sapiens | IC50 | = | 1.83 | nM | PMID[479219] |
| NPT1085 | Cell Line | KETR3 | Homo sapiens | IC50 | = | 9.56 | nM | PMID[479219] |
| NPT179 | Cell Line | A2780 | Homo sapiens | IC50 | = | 2.75 | nM | PMID[479219] |
| NPT83 | Cell Line | MCF7 | Homo sapiens | IC50 | = | 6.39 | nM | PMID[479219] |
| NPT81 | Cell Line | A549 | Homo sapiens | IC50 | = | 40.44 | nM | PMID[479219] |
| NPT165 | Cell Line | HeLa | Homo sapiens | IC50 | = | 1.06 | nM | PMID[479219] |
| NPT91 | Cell Line | KB | Homo sapiens | IC50 | = | 2.23 | nM | PMID[479219] |
| NPT20529 | NON-MOLECULAR | NON-PROTEIN TARGET | n.a. | IC50 | = | 10.98 | nM | PMID[479219] |
| NPT20529 | NON-MOLECULAR | NON-PROTEIN TARGET | n.a. | IC50 | = | 2.54 | nM | PMID[479219] |
☑ Note for Activity Records:
☉ The quantitative biological activities were primarily integrated from ChEMBL (Version-30) database and were also directly collected from PubMed literature. PubMed PMID was provided as the reference link for each activity record.
Top-200 similar NPs were calculated against the active-NP-set (includes 4,3285 NPs with experimentally-derived bioactivity available in NPASS)
Similarity level is defined by Tanimoto coefficient (Tc) between two molecules. Tc lies between [0, 1] where '1' indicates the highest similarity. What is Tanimoto coefficient 
● The left chart: Distribution of similarity level between NPC315110 and all remaining natural products in the NPASS database.
● The right table: Most similar natural products (Tc>=0.56 or Top200).
| Similarity Score | Similarity Level | Natural Product ID |
|---|---|---|
| 0.7538 | Intermediate Similarity | NPC97861 |
| 0.7424 | Intermediate Similarity | NPC161644 |
| 0.7259 | Intermediate Similarity | NPC239252 |
| 0.7259 | Intermediate Similarity | NPC473703 |
| 0.7174 | Intermediate Similarity | NPC473955 |
| 0.705 | Intermediate Similarity | NPC25025 |
| 0.6812 | Remote Similarity | NPC475987 |
| 0.6812 | Remote Similarity | NPC313348 |
| 0.6794 | Remote Similarity | NPC13351 |
| 0.6134 | Remote Similarity | NPC116231 |
| 0.6094 | Remote Similarity | NPC87919 |
| 0.6084 | Remote Similarity | NPC315011 |
| 0.5966 | Remote Similarity | NPC472161 |
| 0.575 | Remote Similarity | NPC475614 |
| 0.5714 | Remote Similarity | NPC139867 |
| 0.5705 | Remote Similarity | NPC82129 |
| 0.5645 | Remote Similarity | NPC236322 |
Similarity level is defined by Tanimoto coefficient (Tc) between two molecules.
● The left chart: Distribution of similarity level between NPC315110 and all drugs/candidates.
● The right table: Most similar clinical/approved drugs (Tc>=0.56 or Top200).
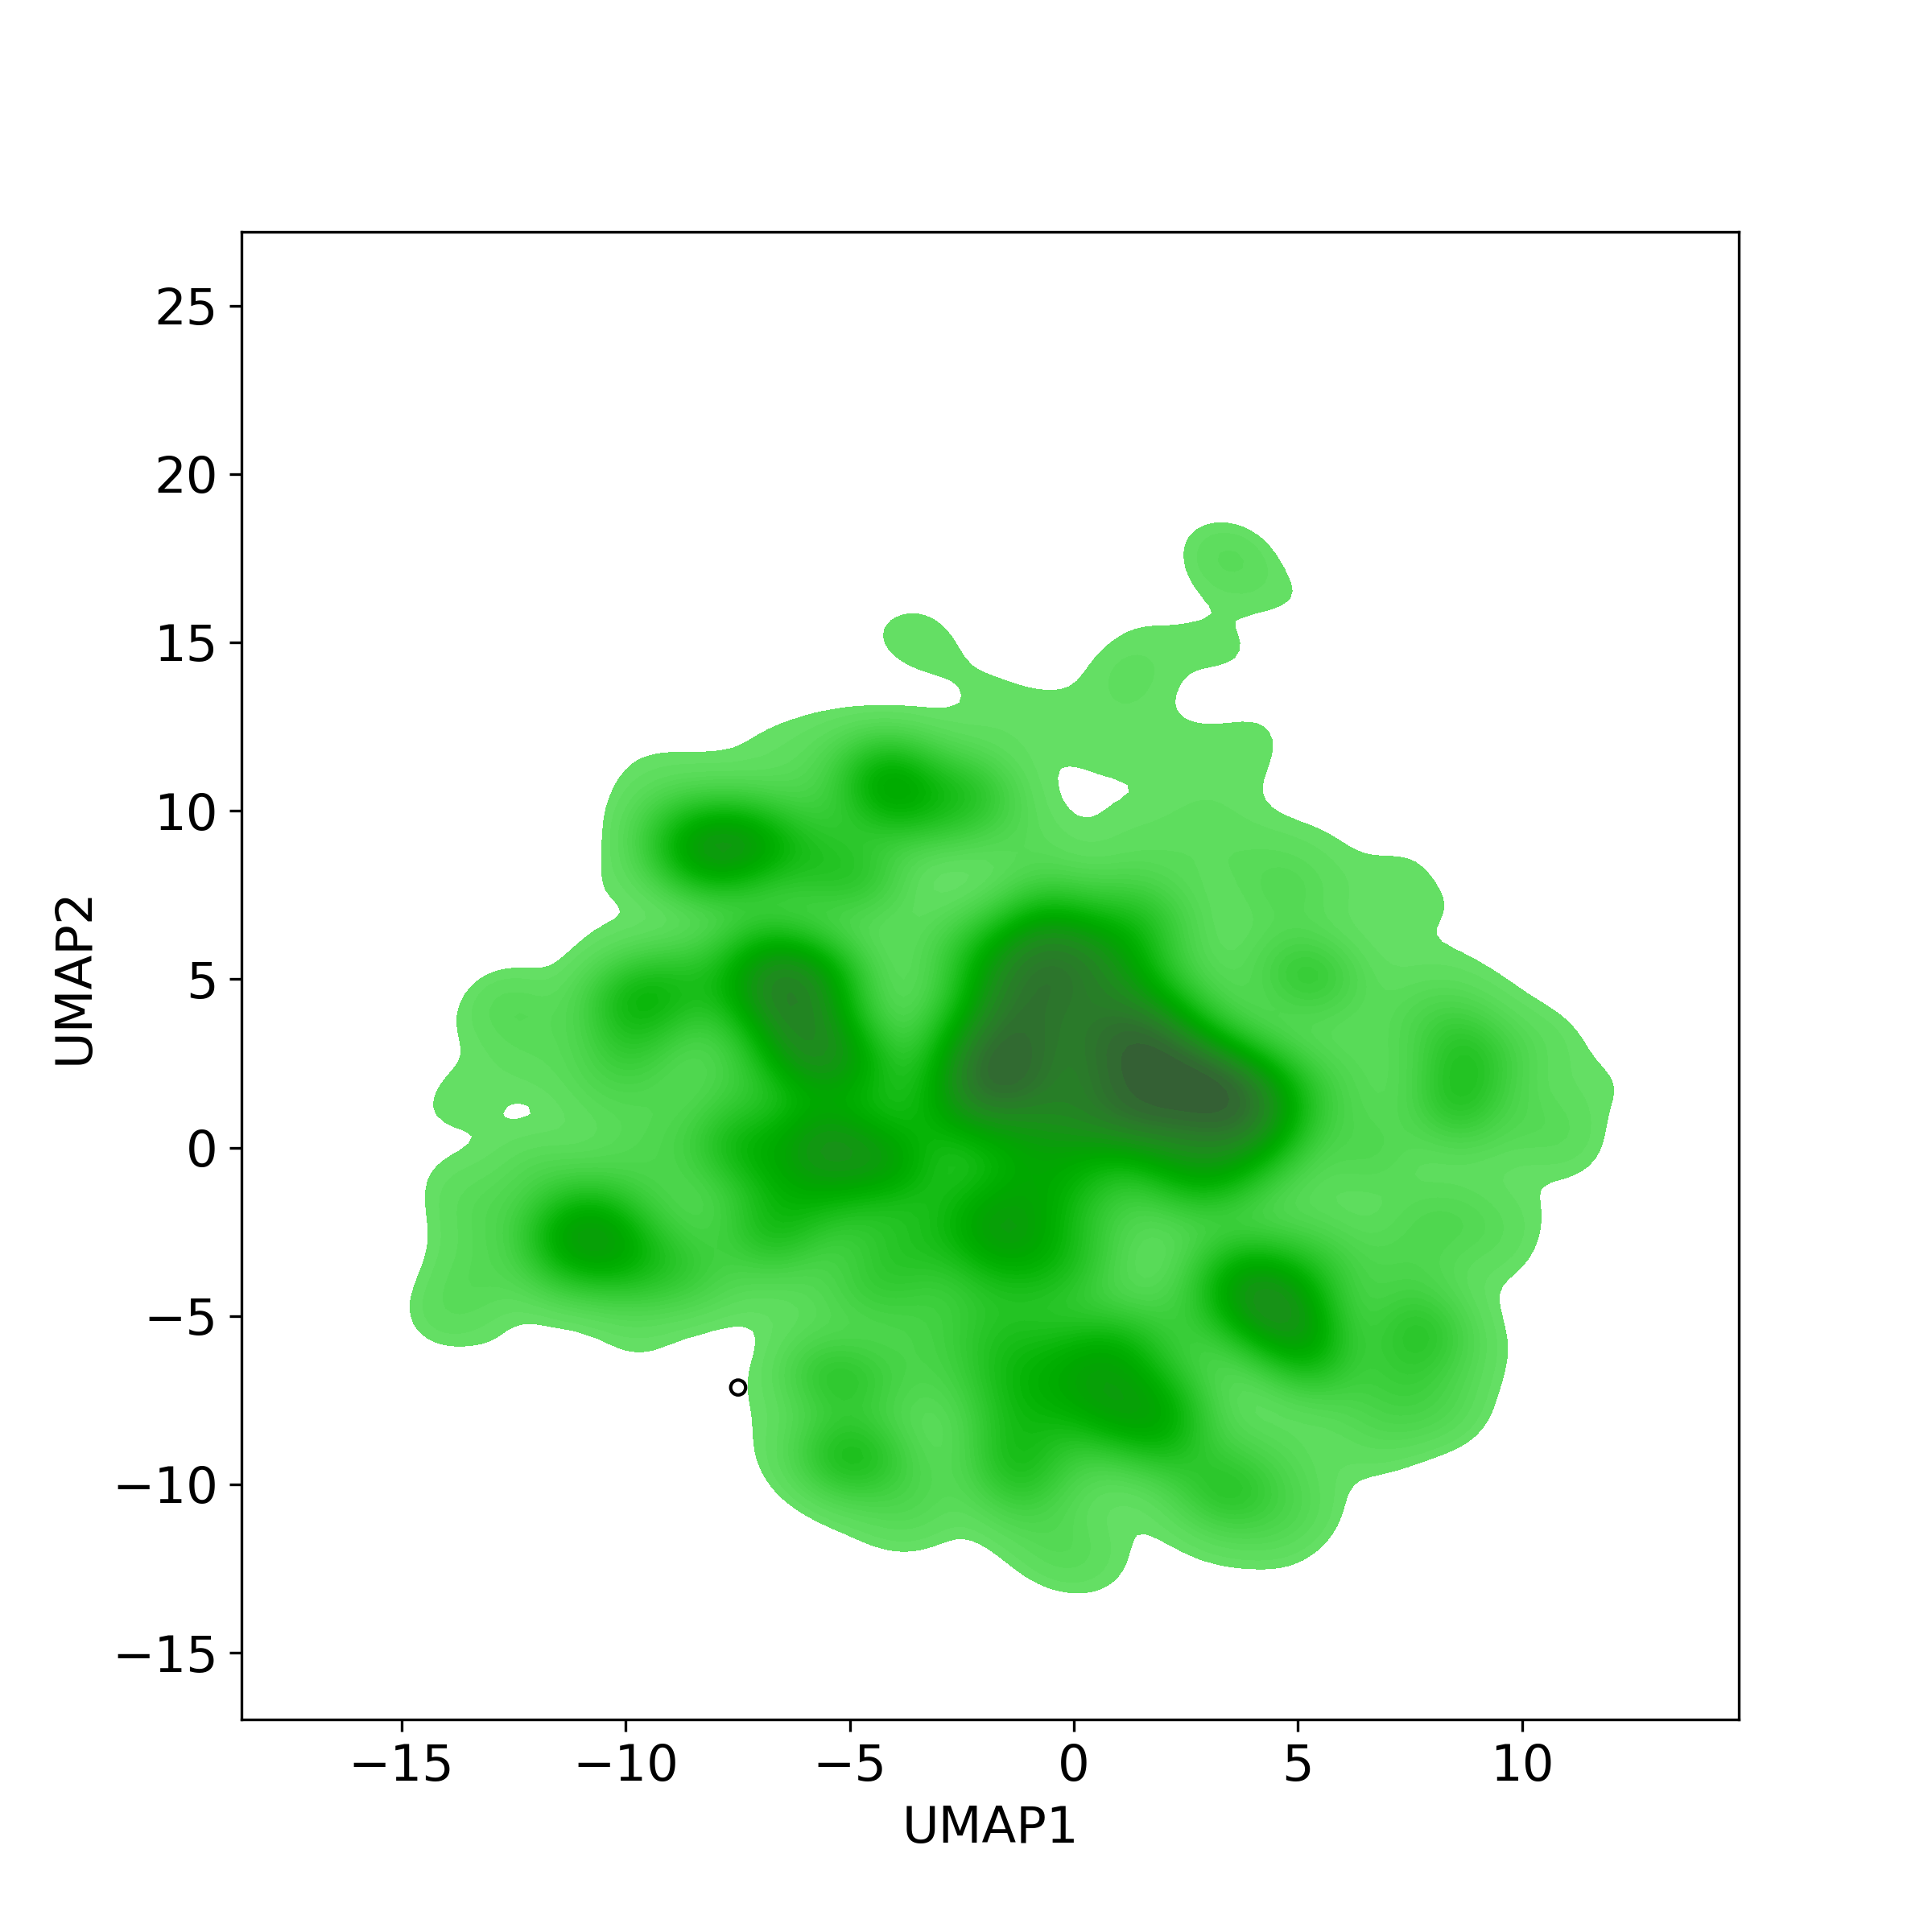
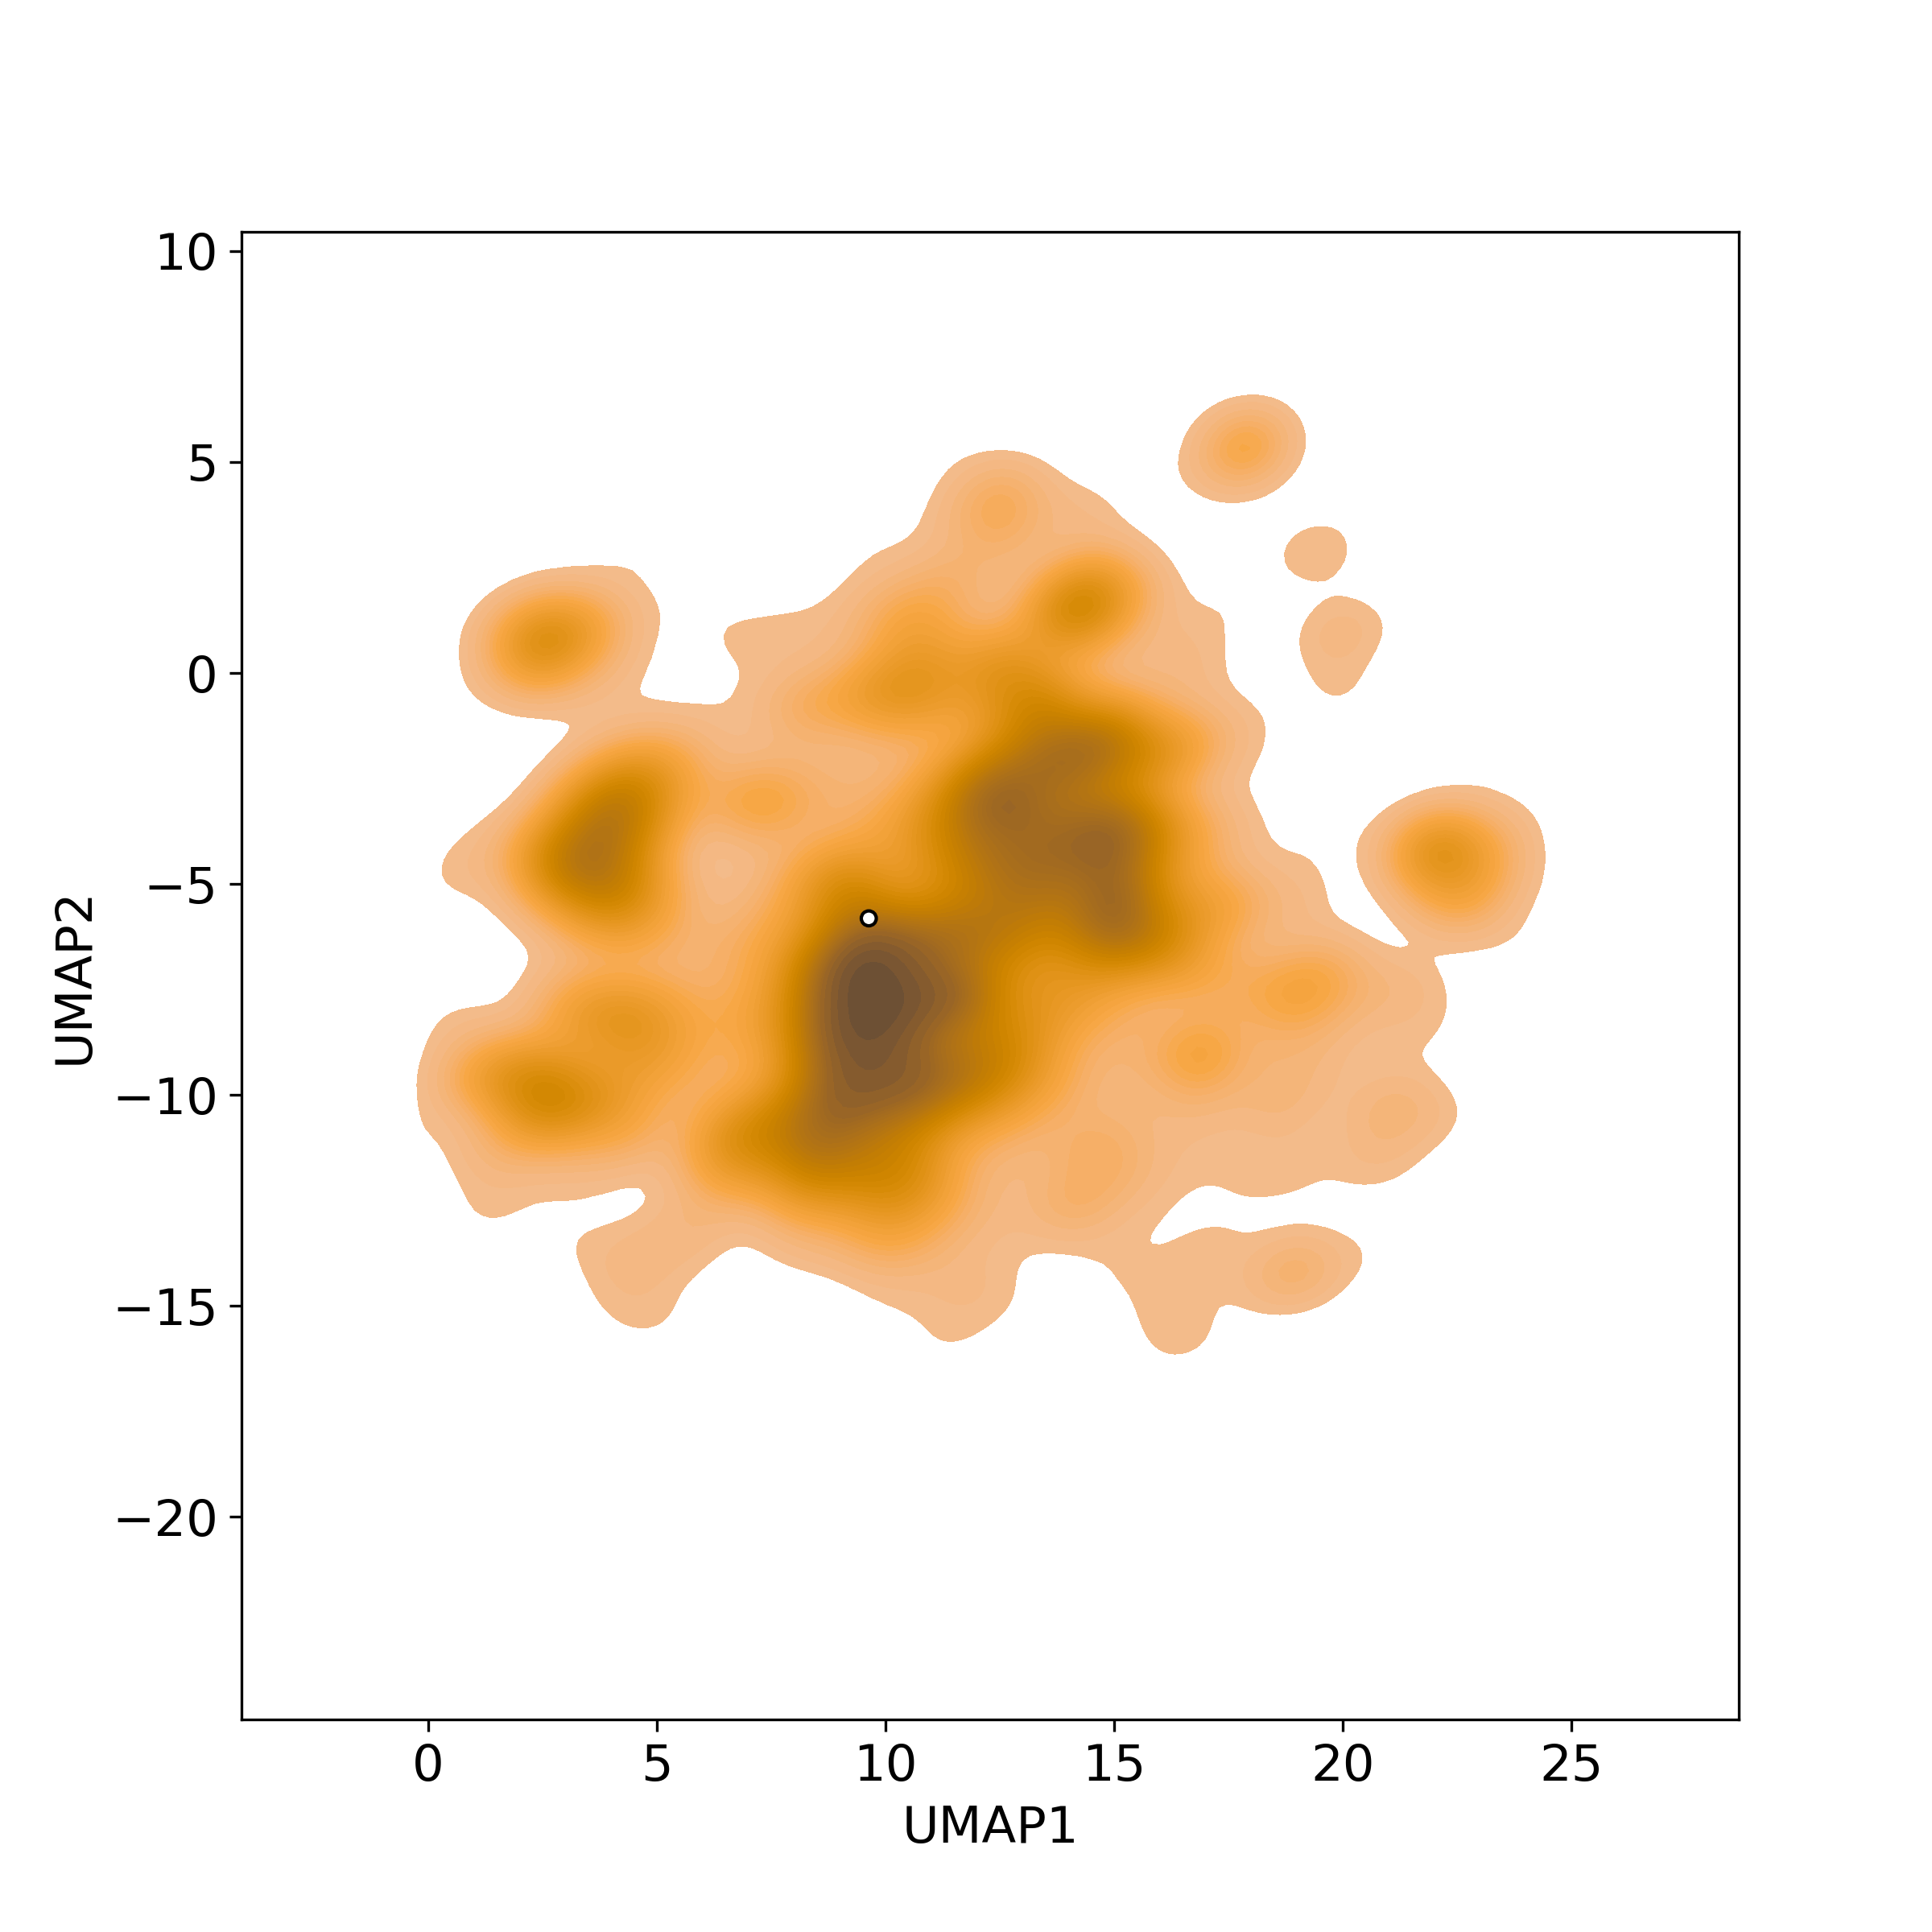
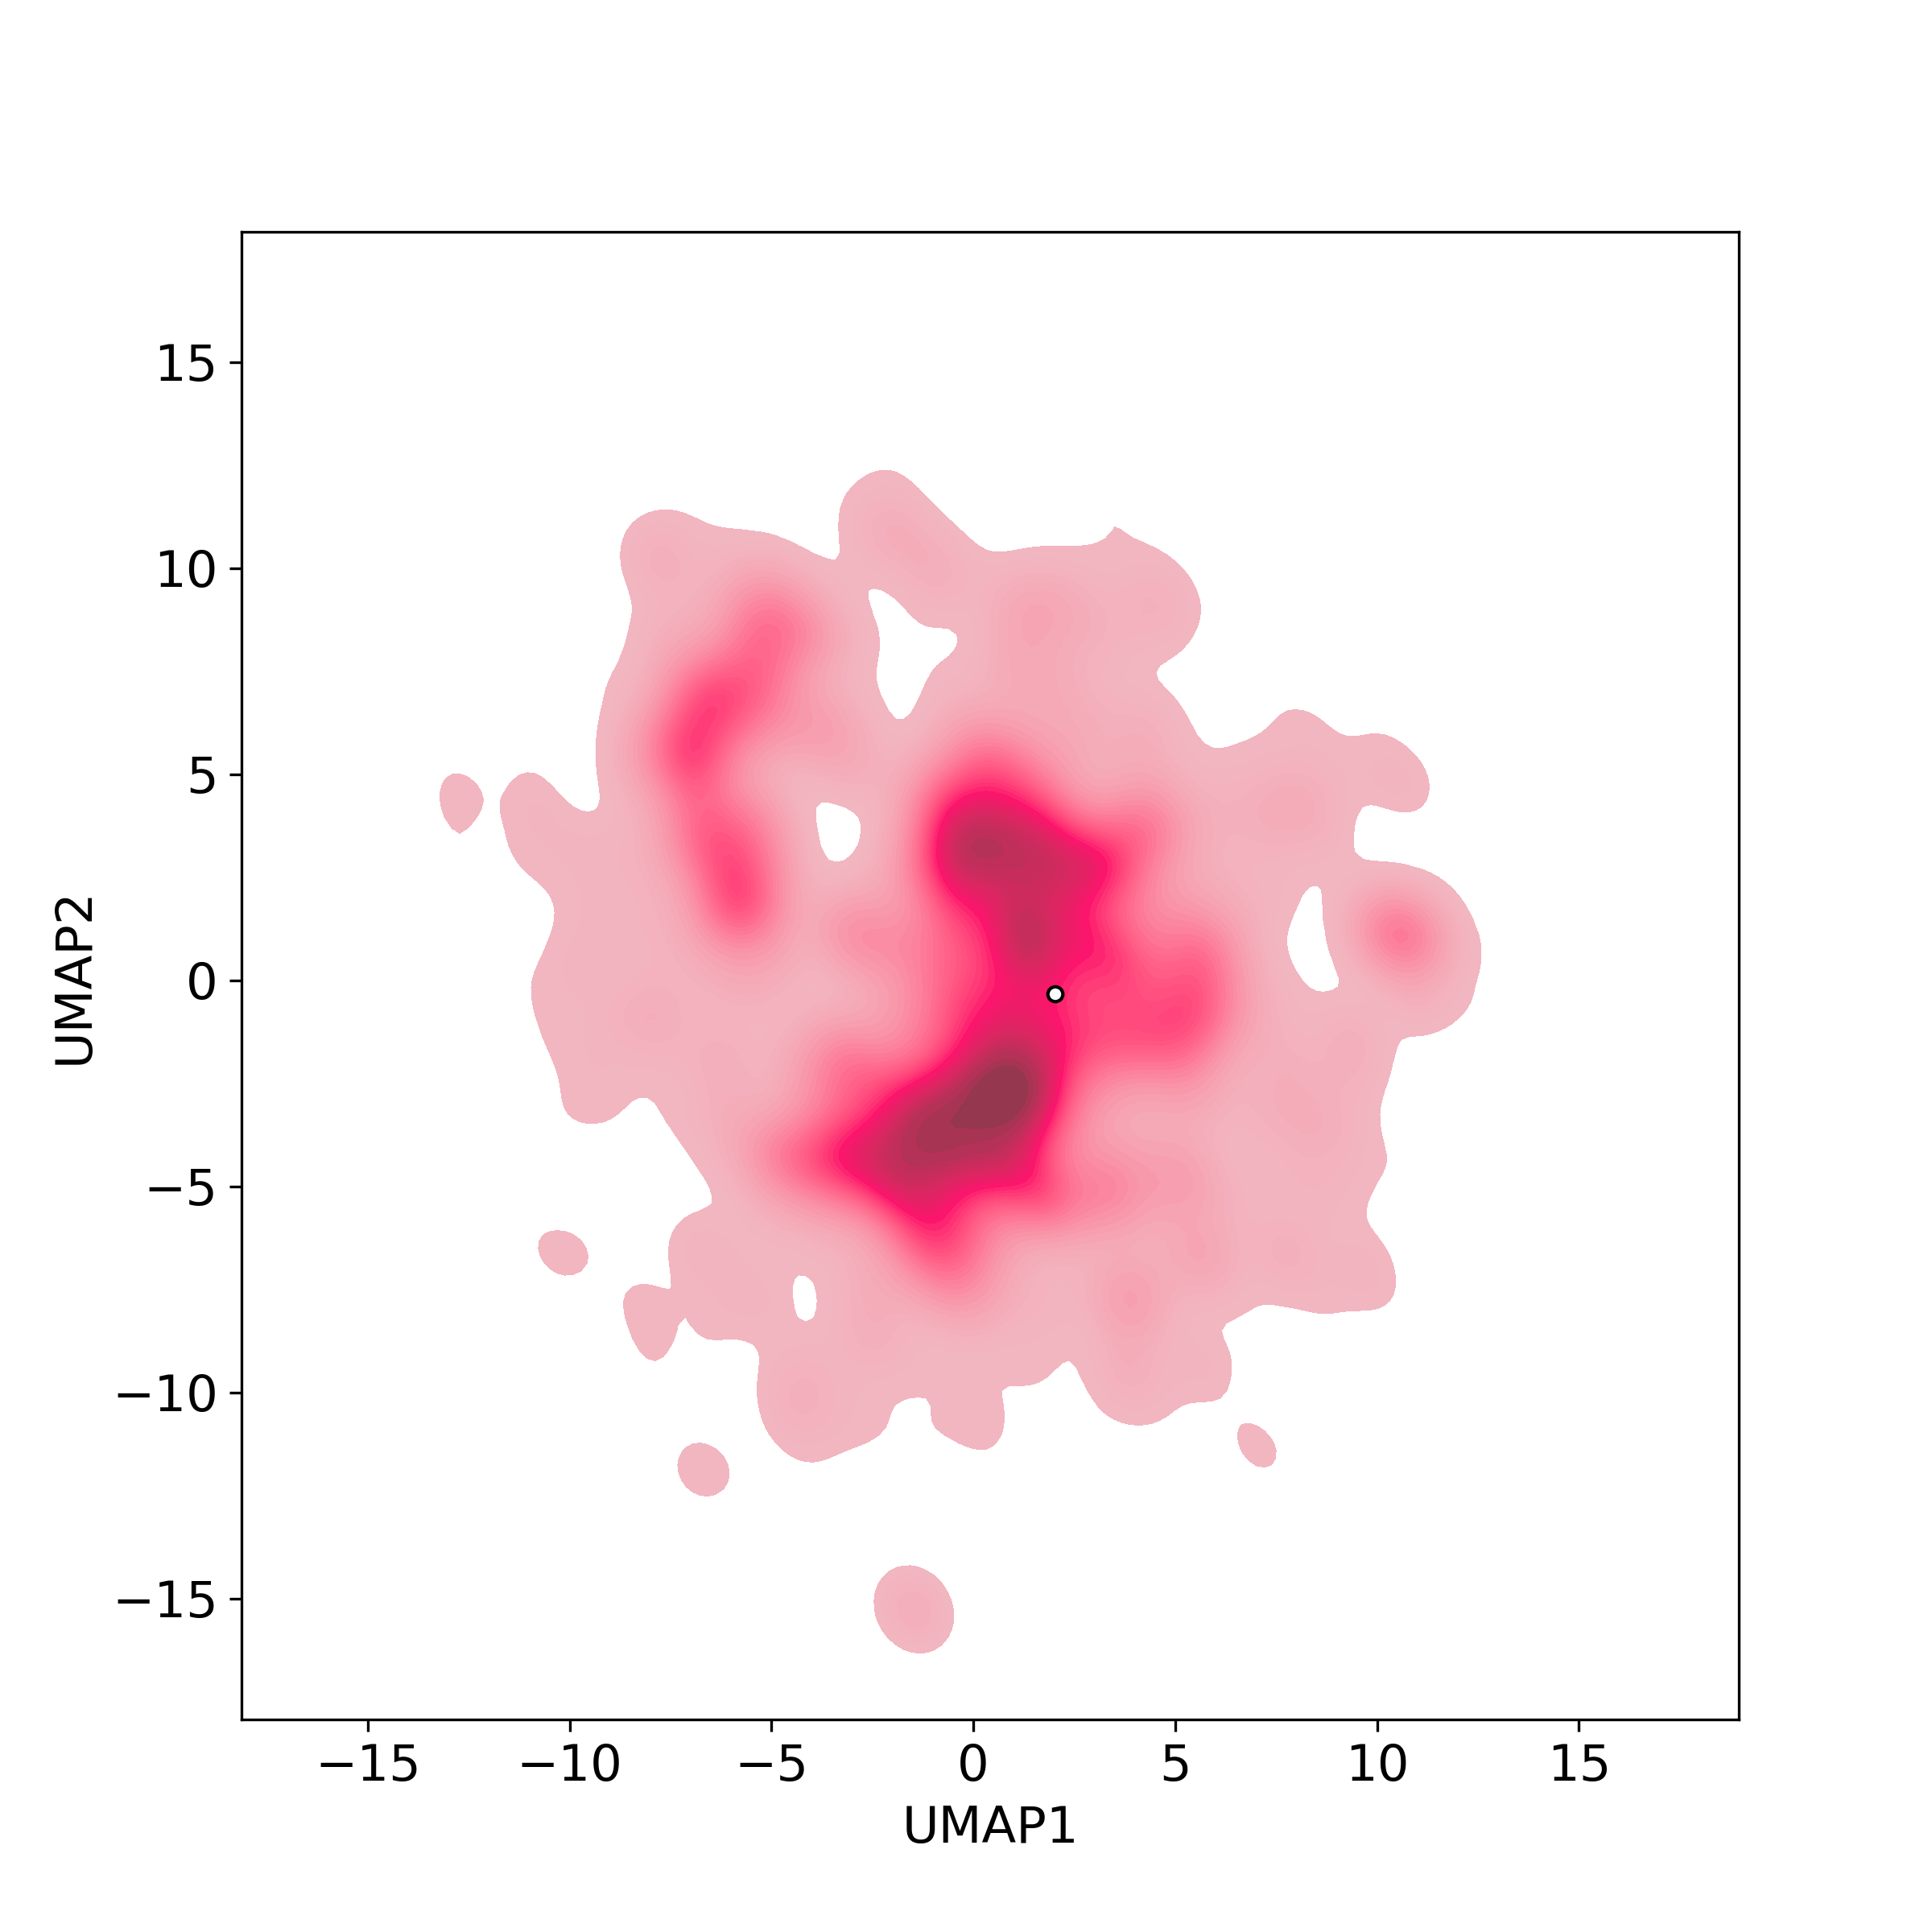
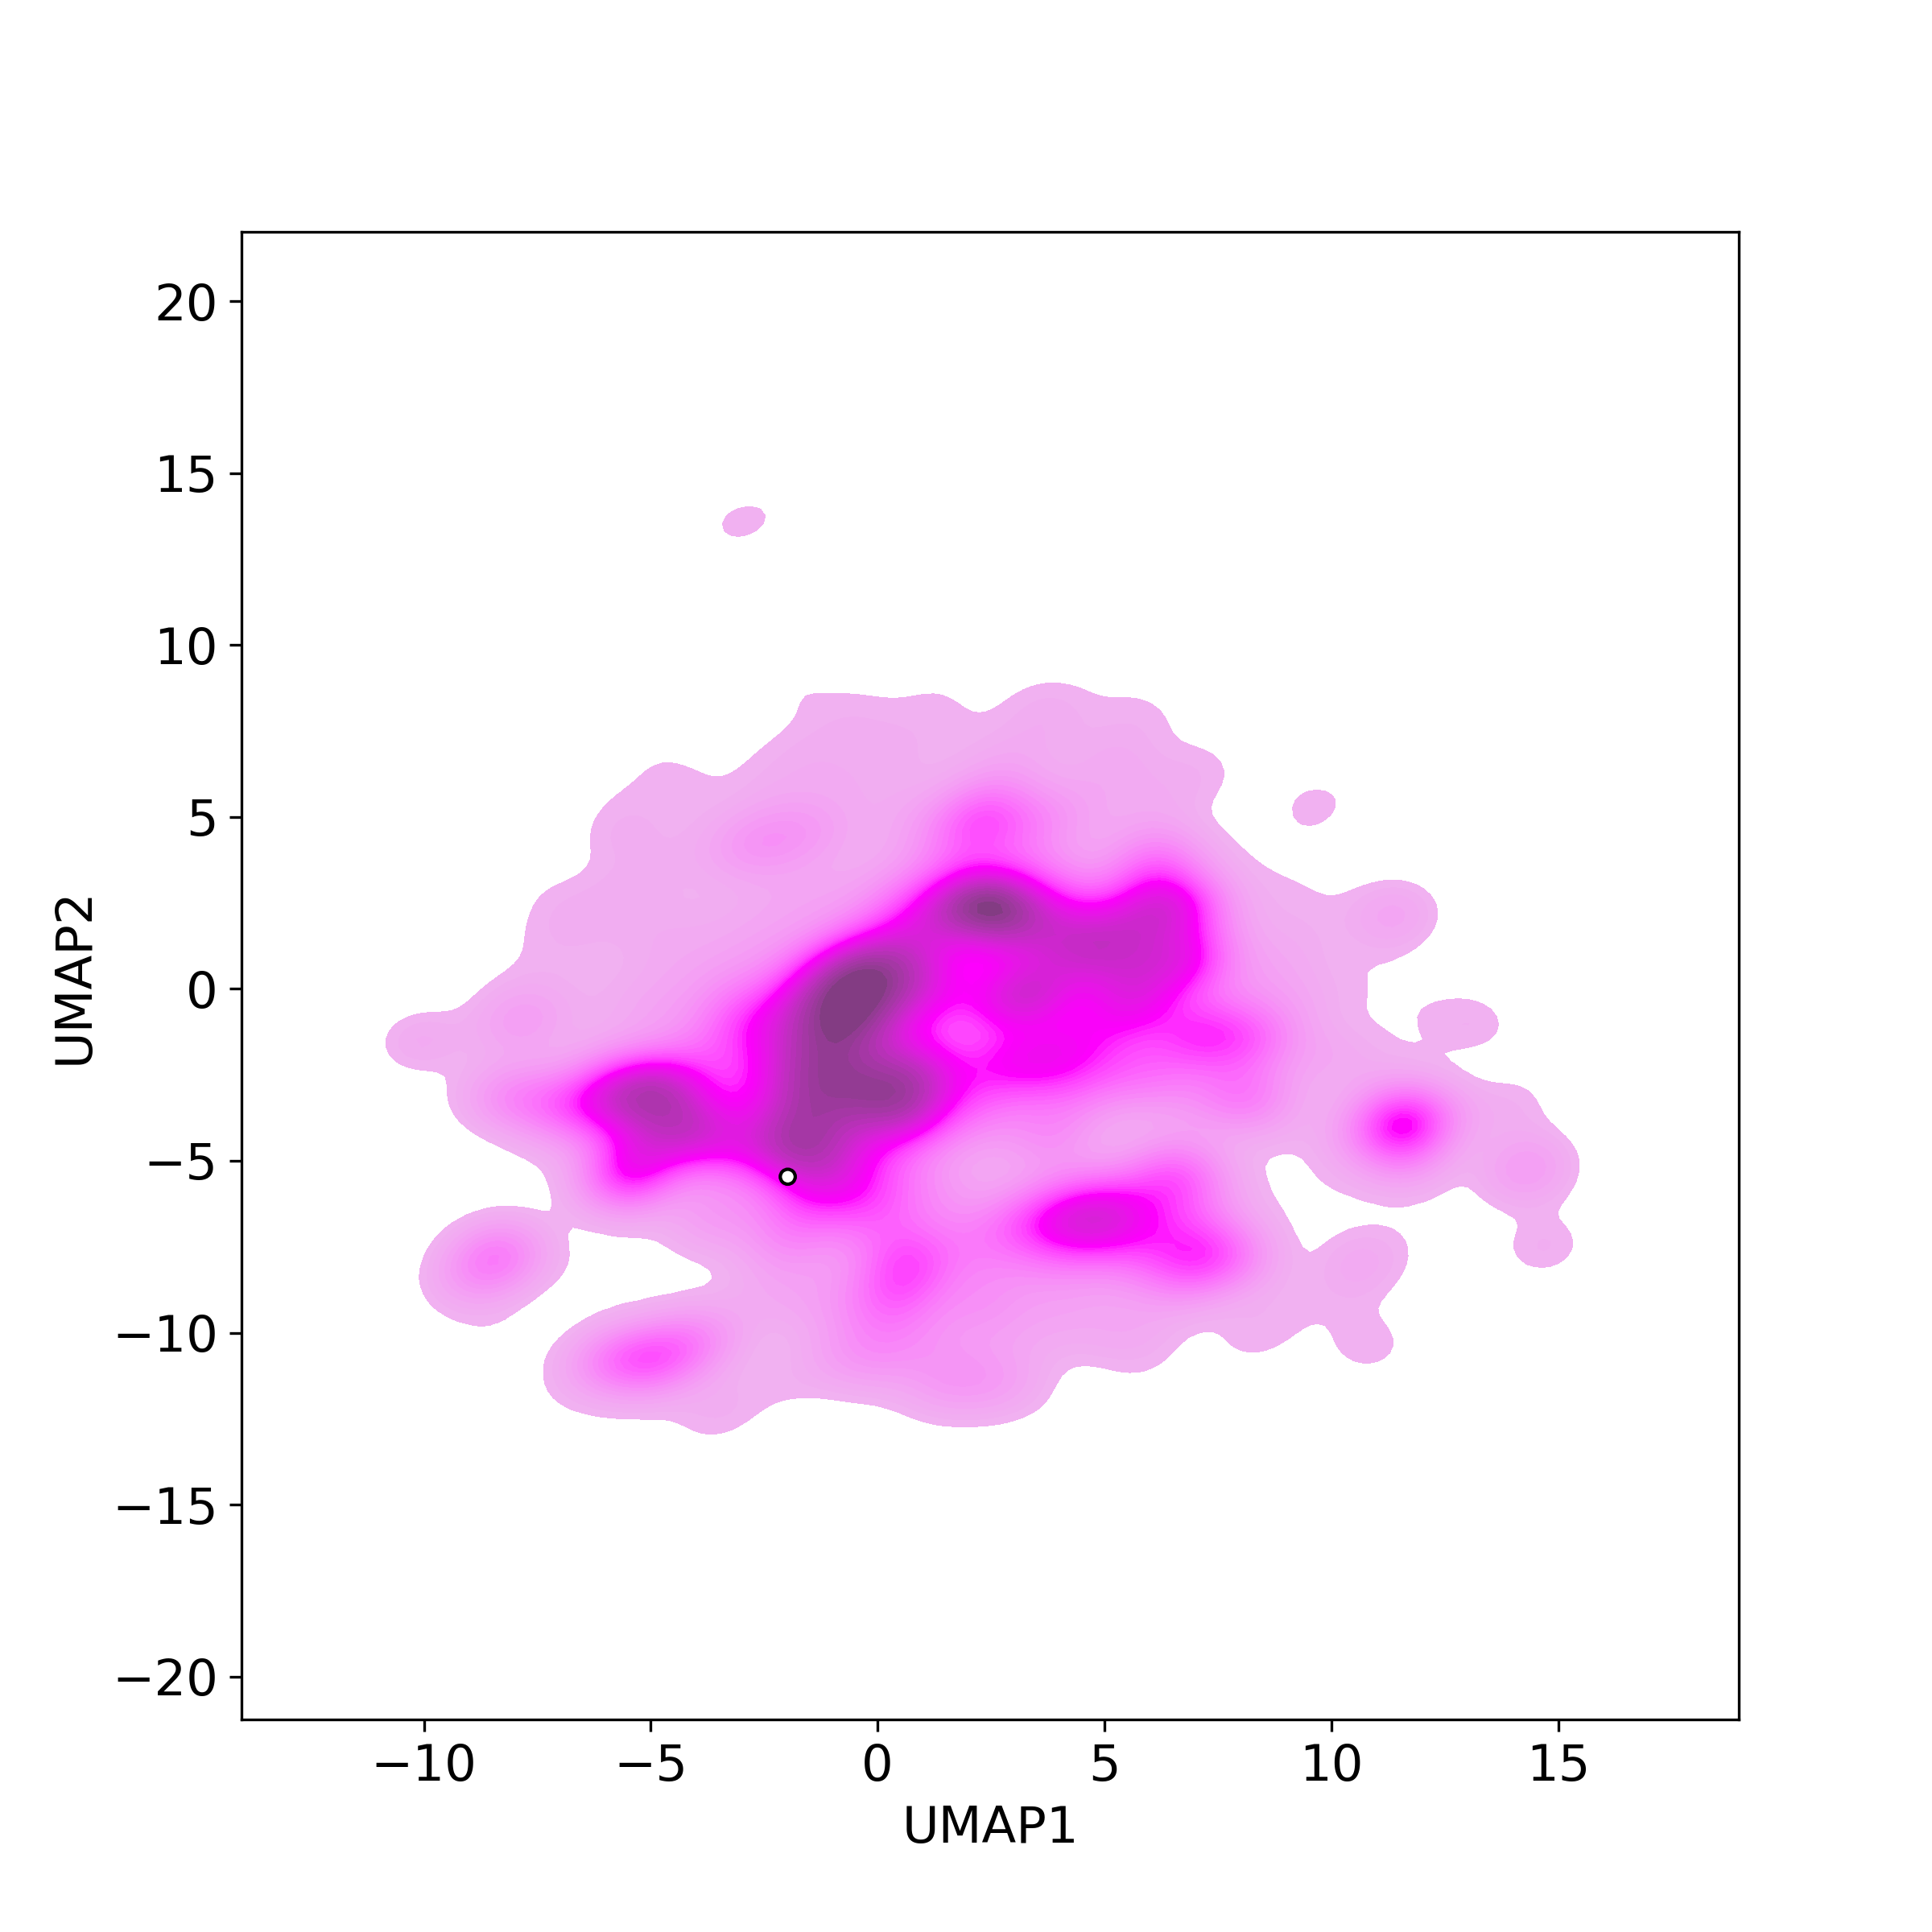
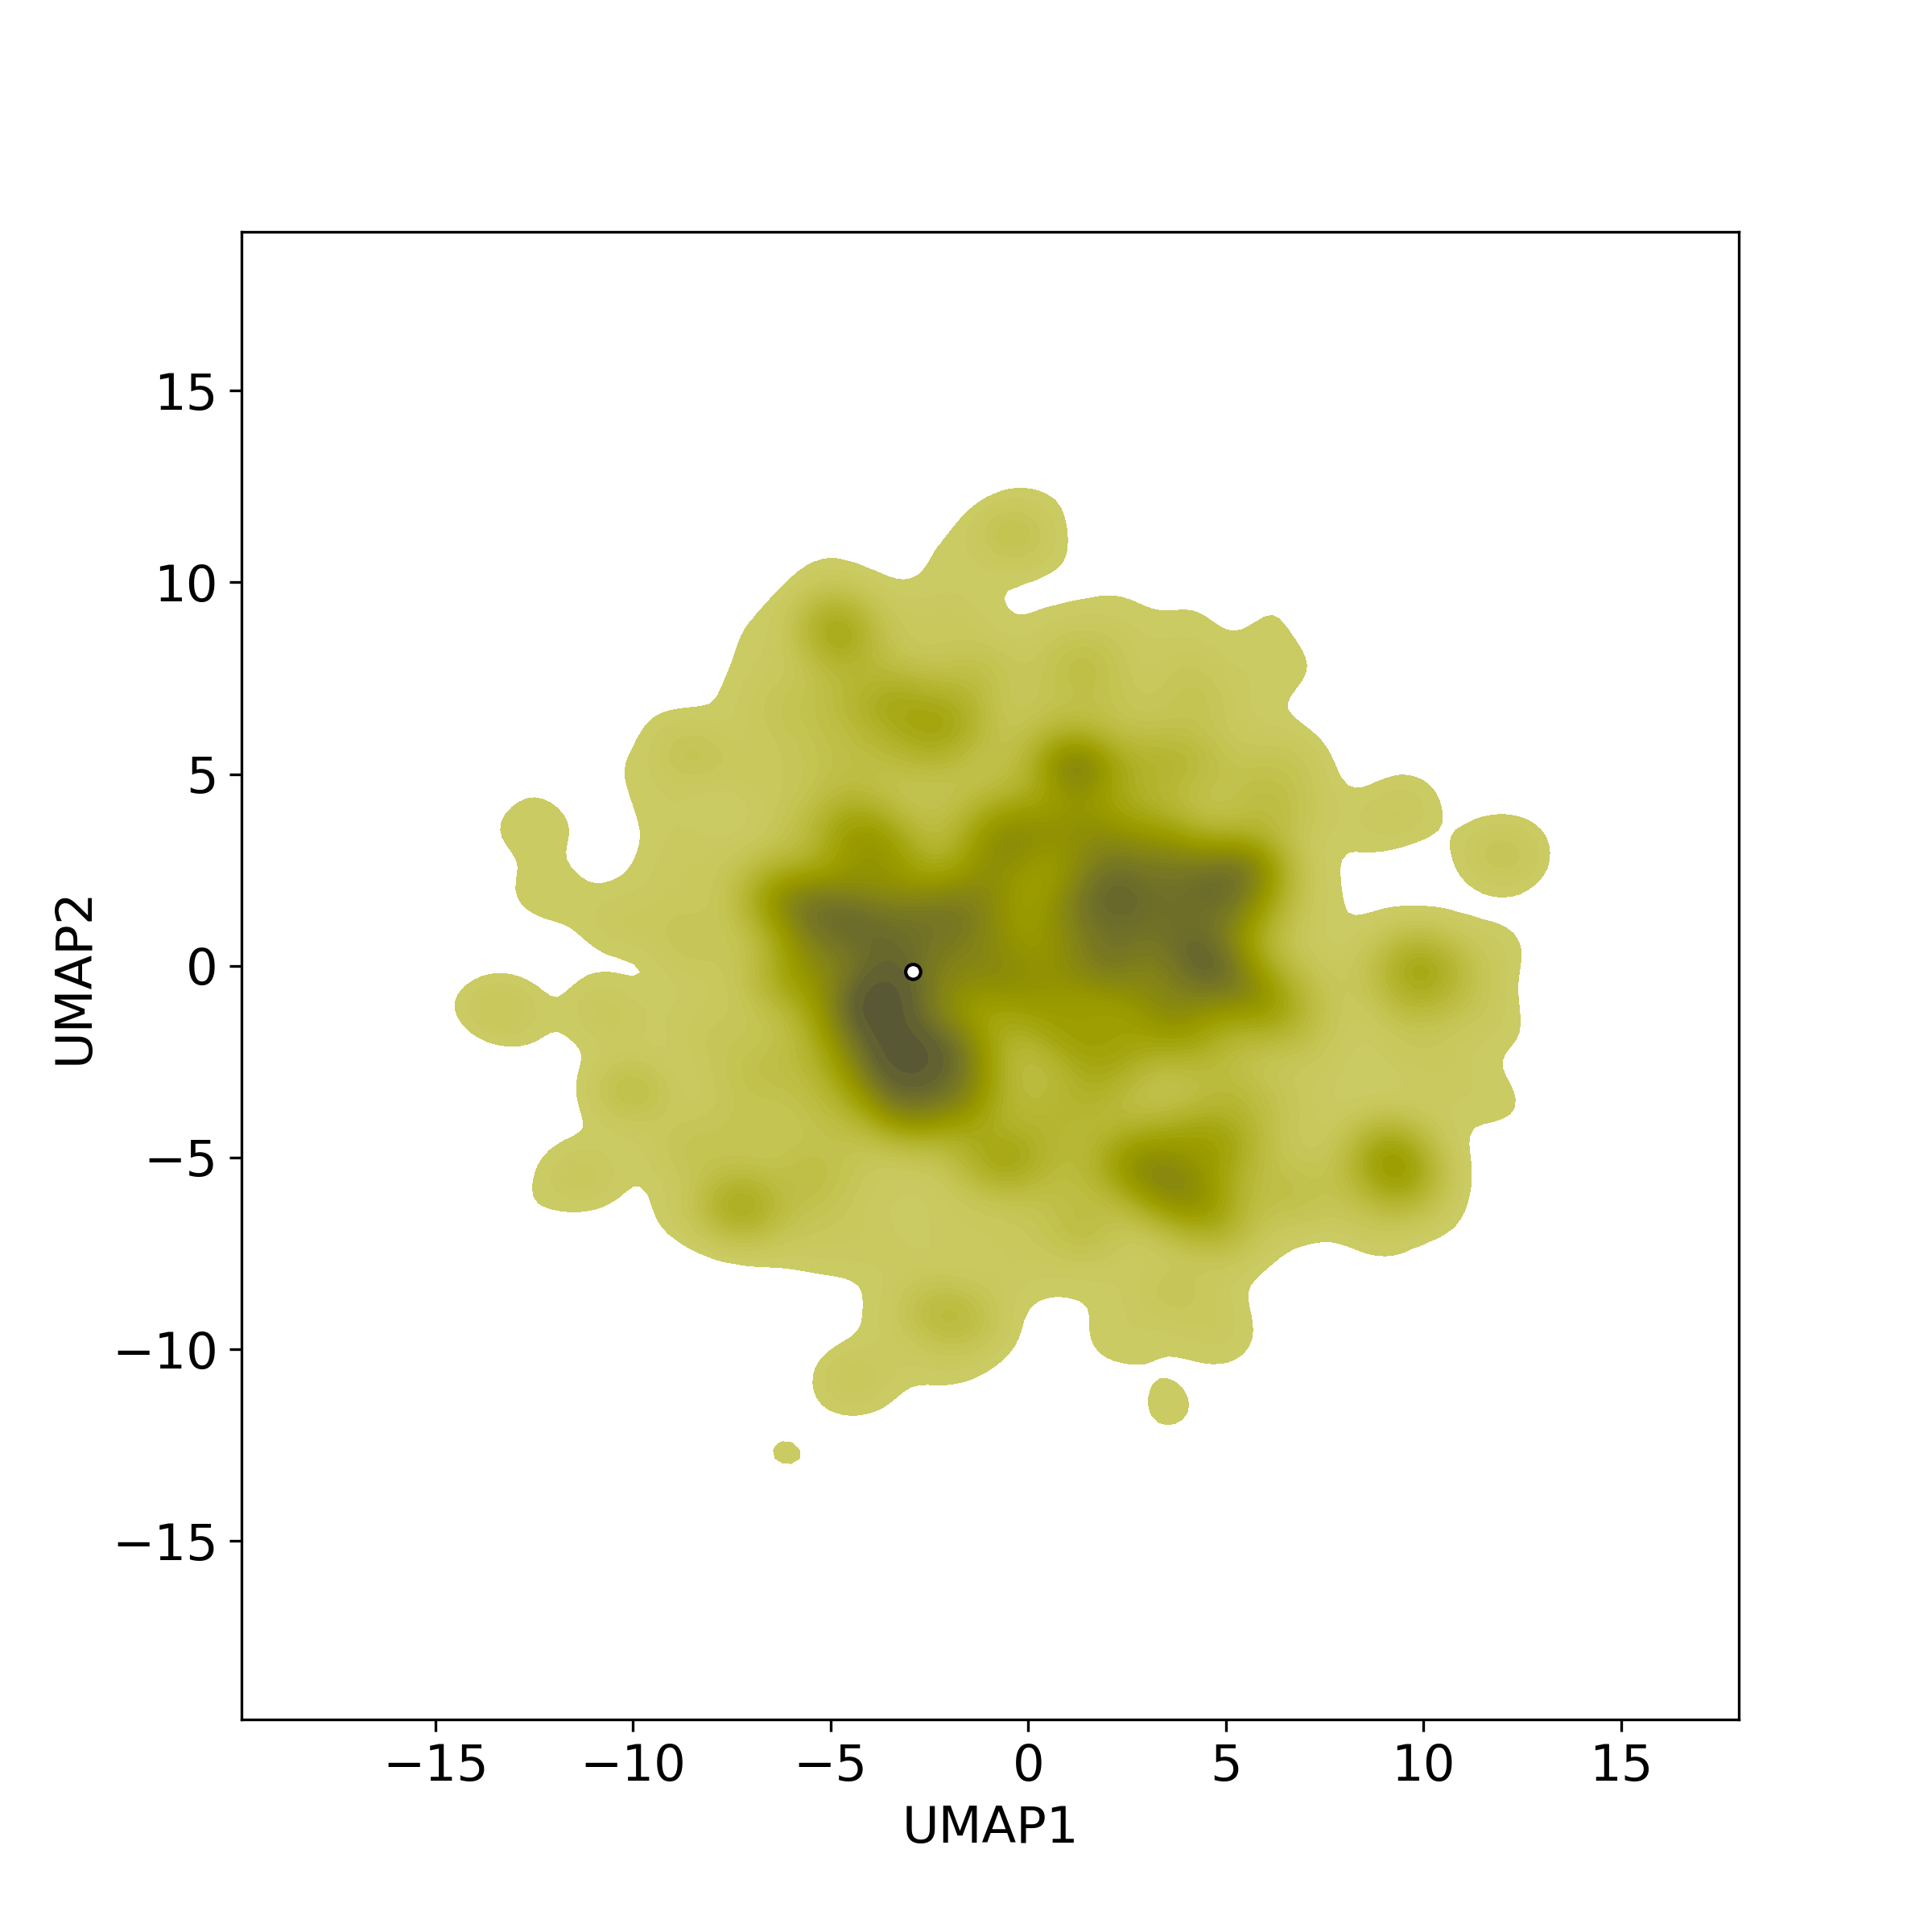
Bioactivity similarity was calculated based on bioactivity descriptors of compounds. The bioactivity descriptors were calculated by a recently developed AI algorithm Chemical Checker (CC) [Nature Biotechnology, 38:1087–1096, 2020; Nature Communications, 12:3932, 2021], which evaluated bioactivity similarities at five levels:
☉ A: chemistry similarity;
☉ B: biological targets similarity;
☉ C: networks similarity;
☉ D: cell-based bioactivity similarity;
☉ E: similarity based on clinical data.
Those 5 categories of CC bioactivity descriptors were calculated and then subjected to manifold projection using UMAP algorithm, to project all NPs on a 2-Dimensional space. The current NP was highlighted with a small circle in the 2-D map. Below figures: left-to-right, A-to-E.