1. BROWSE THE DATABASE
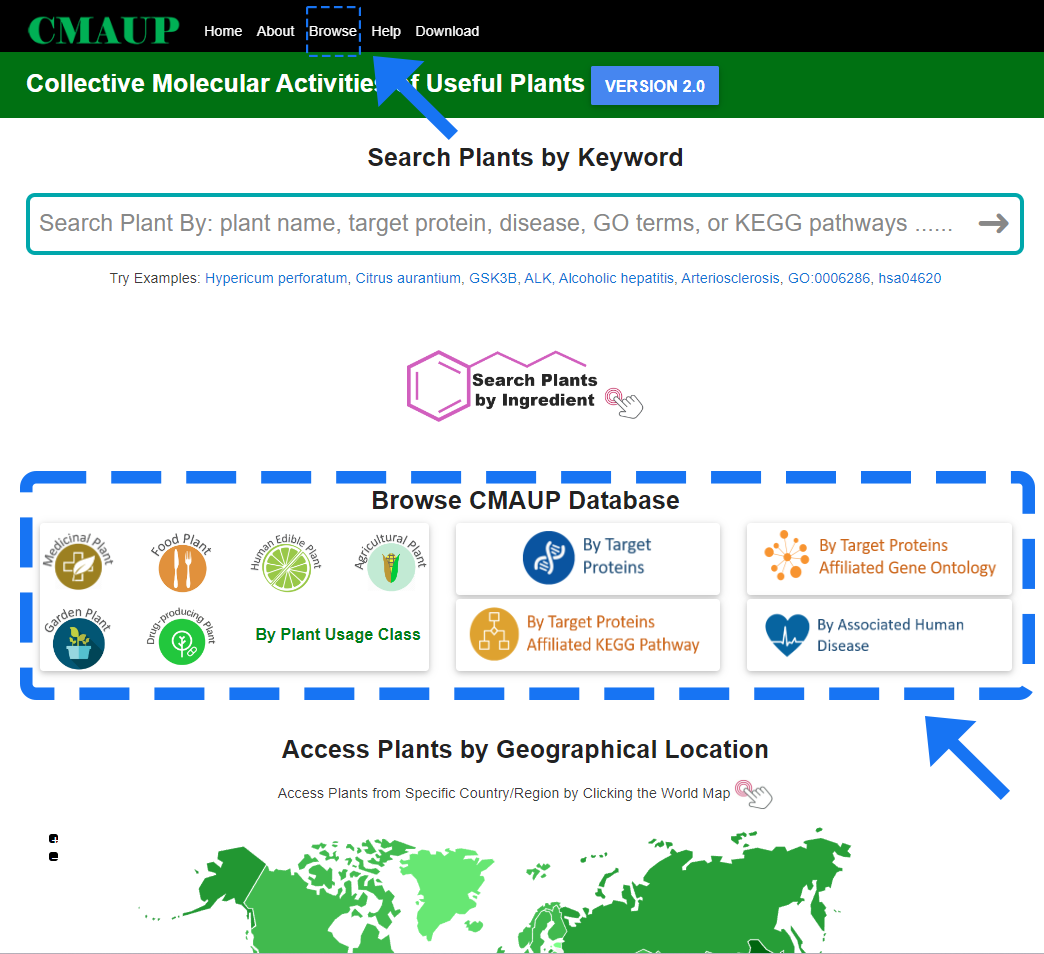
By clicking each section under the “Browse CMAUP Database”, users will be redirected to a new page where one can browse the database by multiple ways. Alternatively, users can click the button "Browse" on the top of the homepage to browse plants.
1.1 Browse CMAUP by plant family
The current version of CMAUP includes 5754 plant species which from 345 taxonomic families. Users can access plants of a specific family by click the family name in the first column of the table.

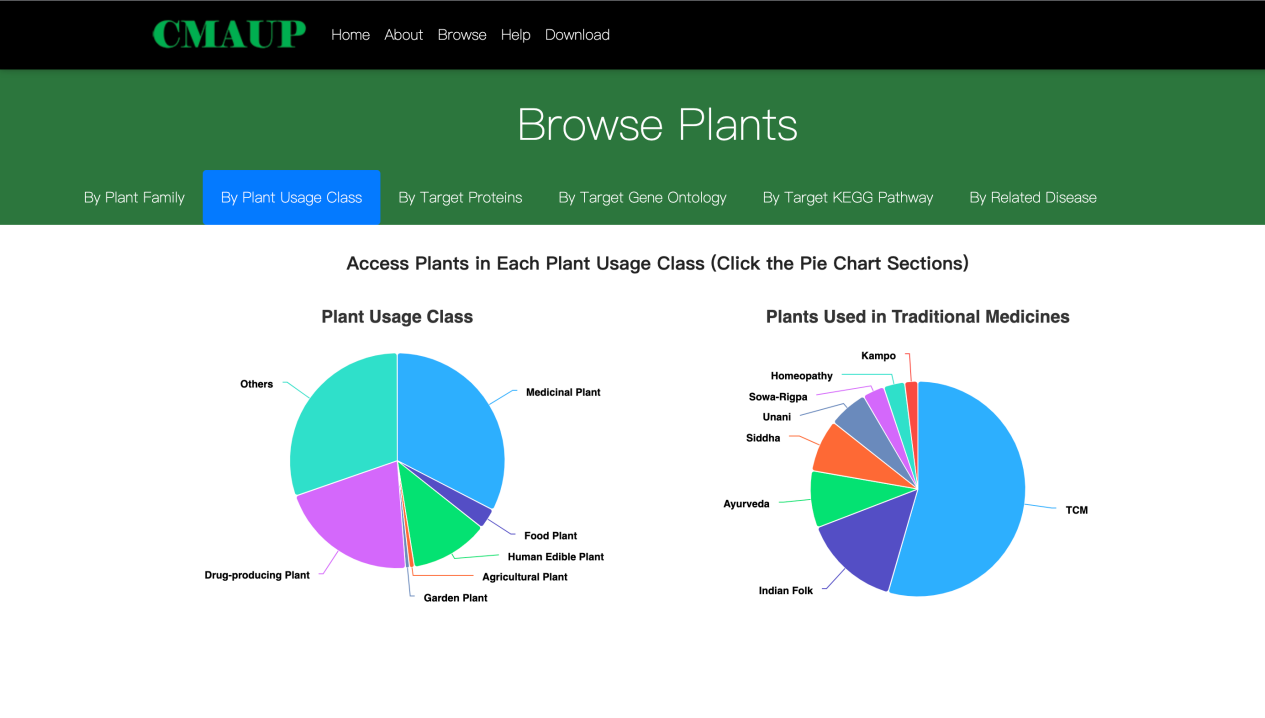
1.2. Browse CMAUP by plant usage class
Generally, plants are categorized into several usage classes: Medicinal Used Plant; Human Edible Plant; Agricultural Plant; Garden Plant; and Others. Moreover, the medicinal used plants are further labelled with traditional medicine systems that uses the plant as medicinal herb. These traditional medicine systems include: TCM (Traditional Chinese Medicine); Indian Folk; Ayurveda; Siddha; Unani; Sowa-Rigpa; Homeopathy; and Kampo. Users can access plants of each category by clicking the pie charts.
1.3. Browse CMAUP by target proteins
Target proteins of plants are classified into few categories: Kinase; Oxidoreductase; Protease; GPCR; Ion Channel; Transporter; Nuclear Receptor; Unclassified and so on. Users can re-order the targets by each table columns such as “target Category”, then access plants by a specific target (click the target gene symbol).

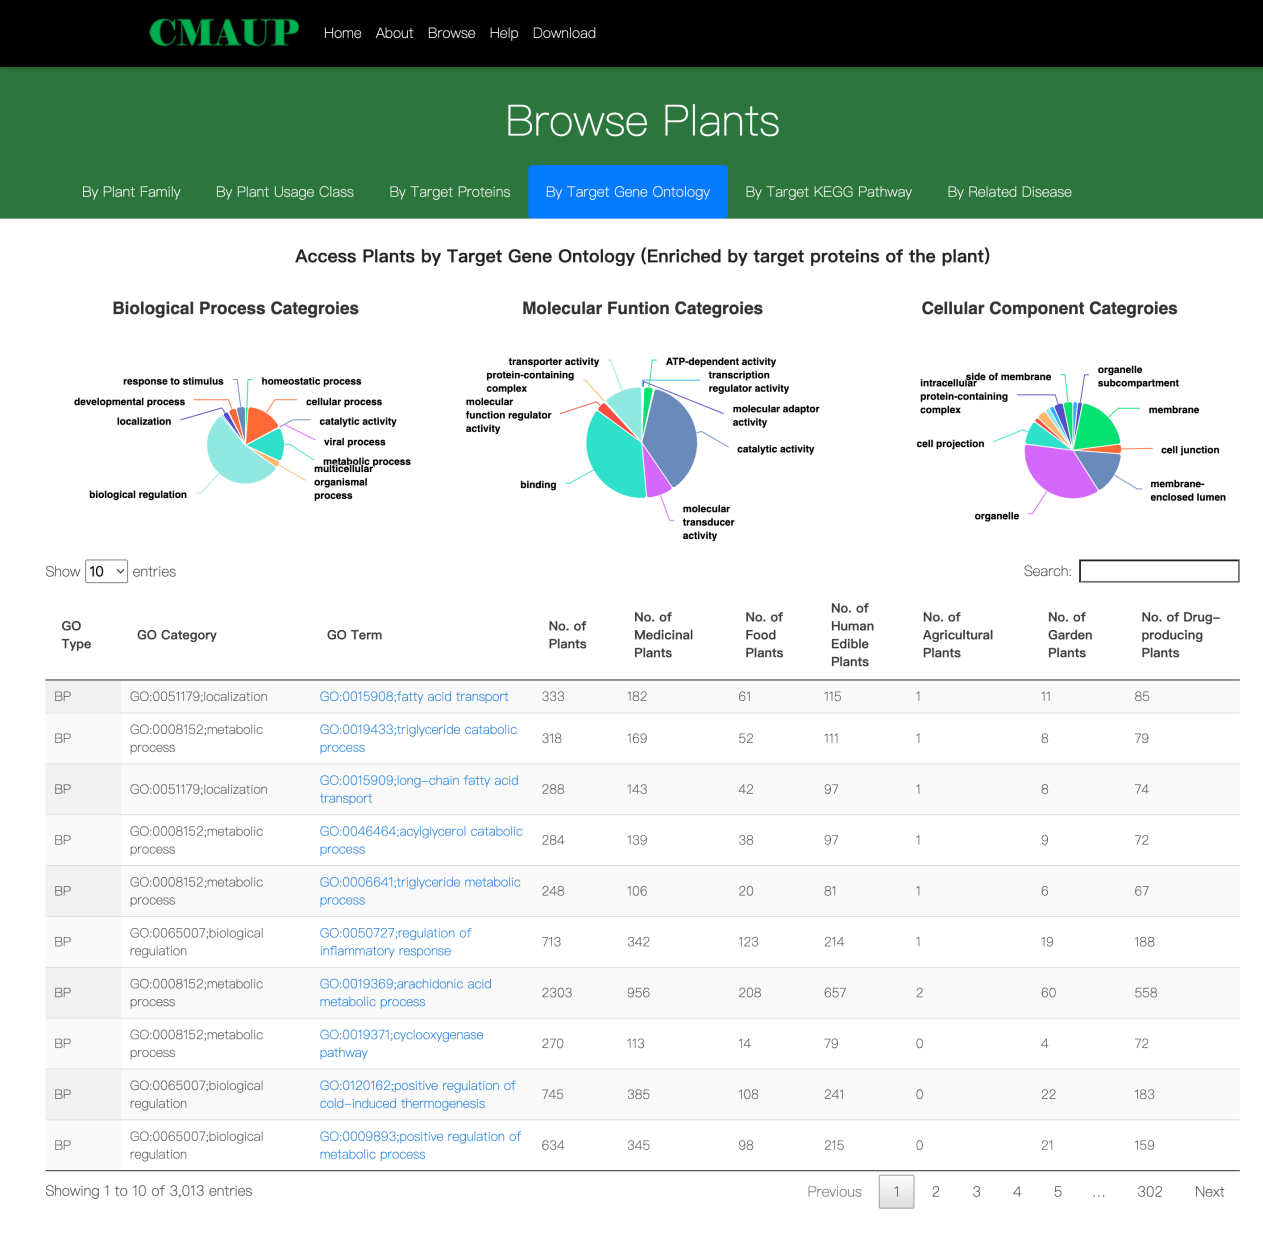
1.4. Browse CMAUP by target gene ontology
Gene ontology (GO) terms were enriched for genes of protein targets of each plant. GO terms are categorized by the categories of GO hierarchical system. Users can re-order the GO terms by their categories and access plants of a specific GO term by clicking the “GO Term”.
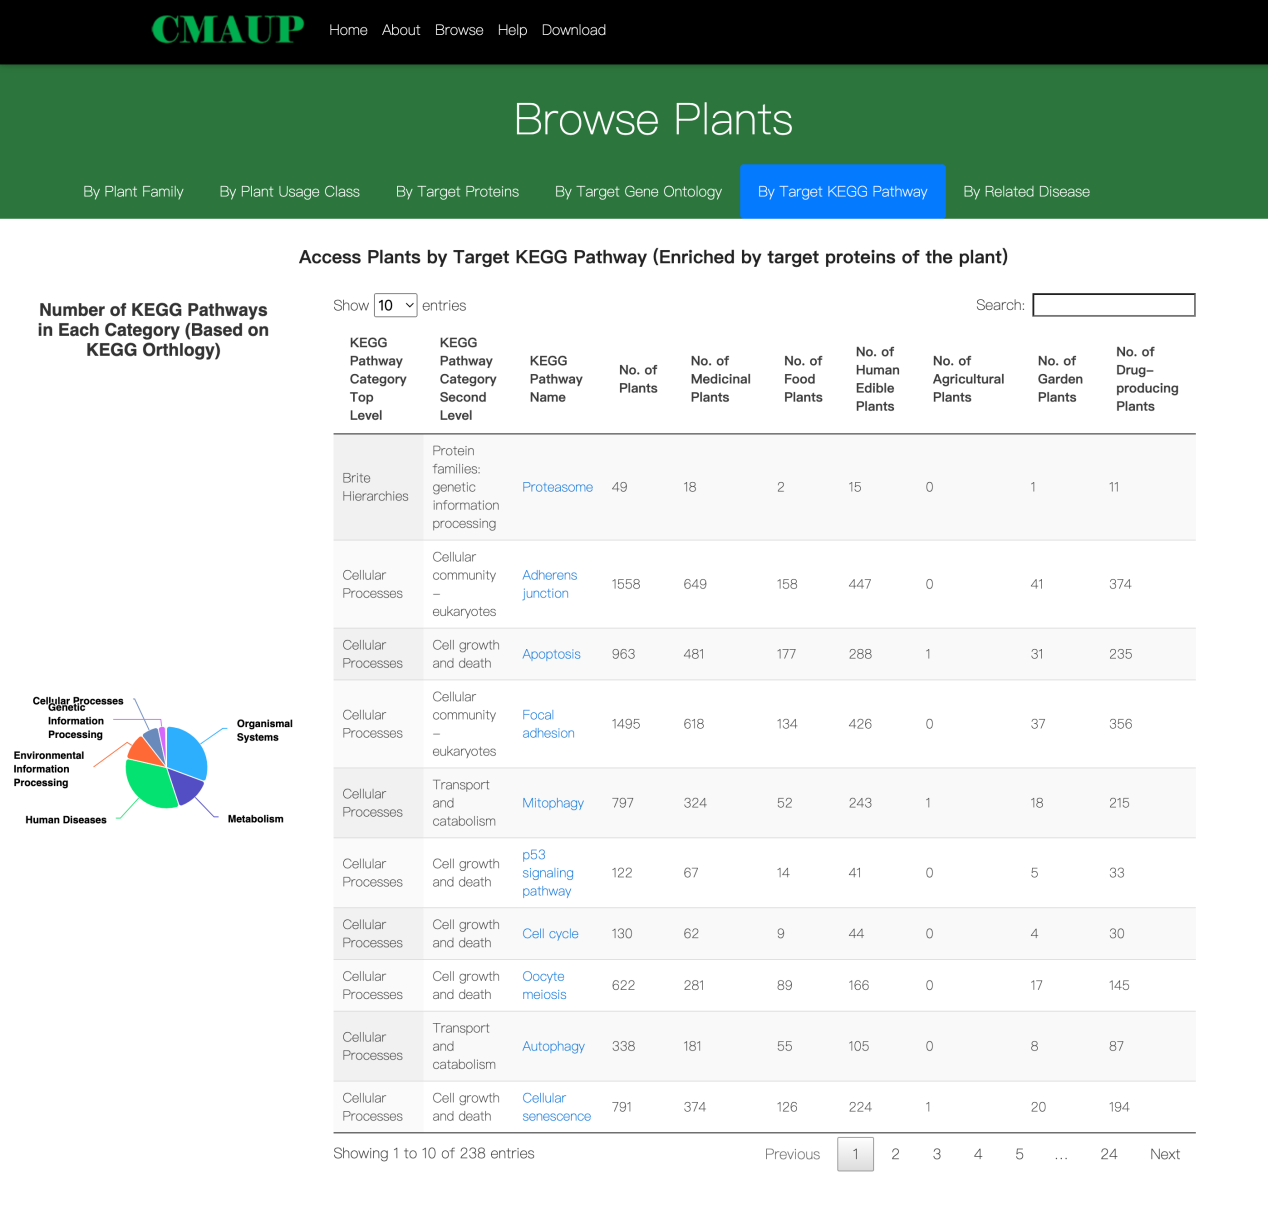
1.5. Browse CMAUP by target KEGG pathway
Genes of protein targets of plants were also enriched for KEGG pathways. Users can access plants of a specific pathway by clicking the pathway name.
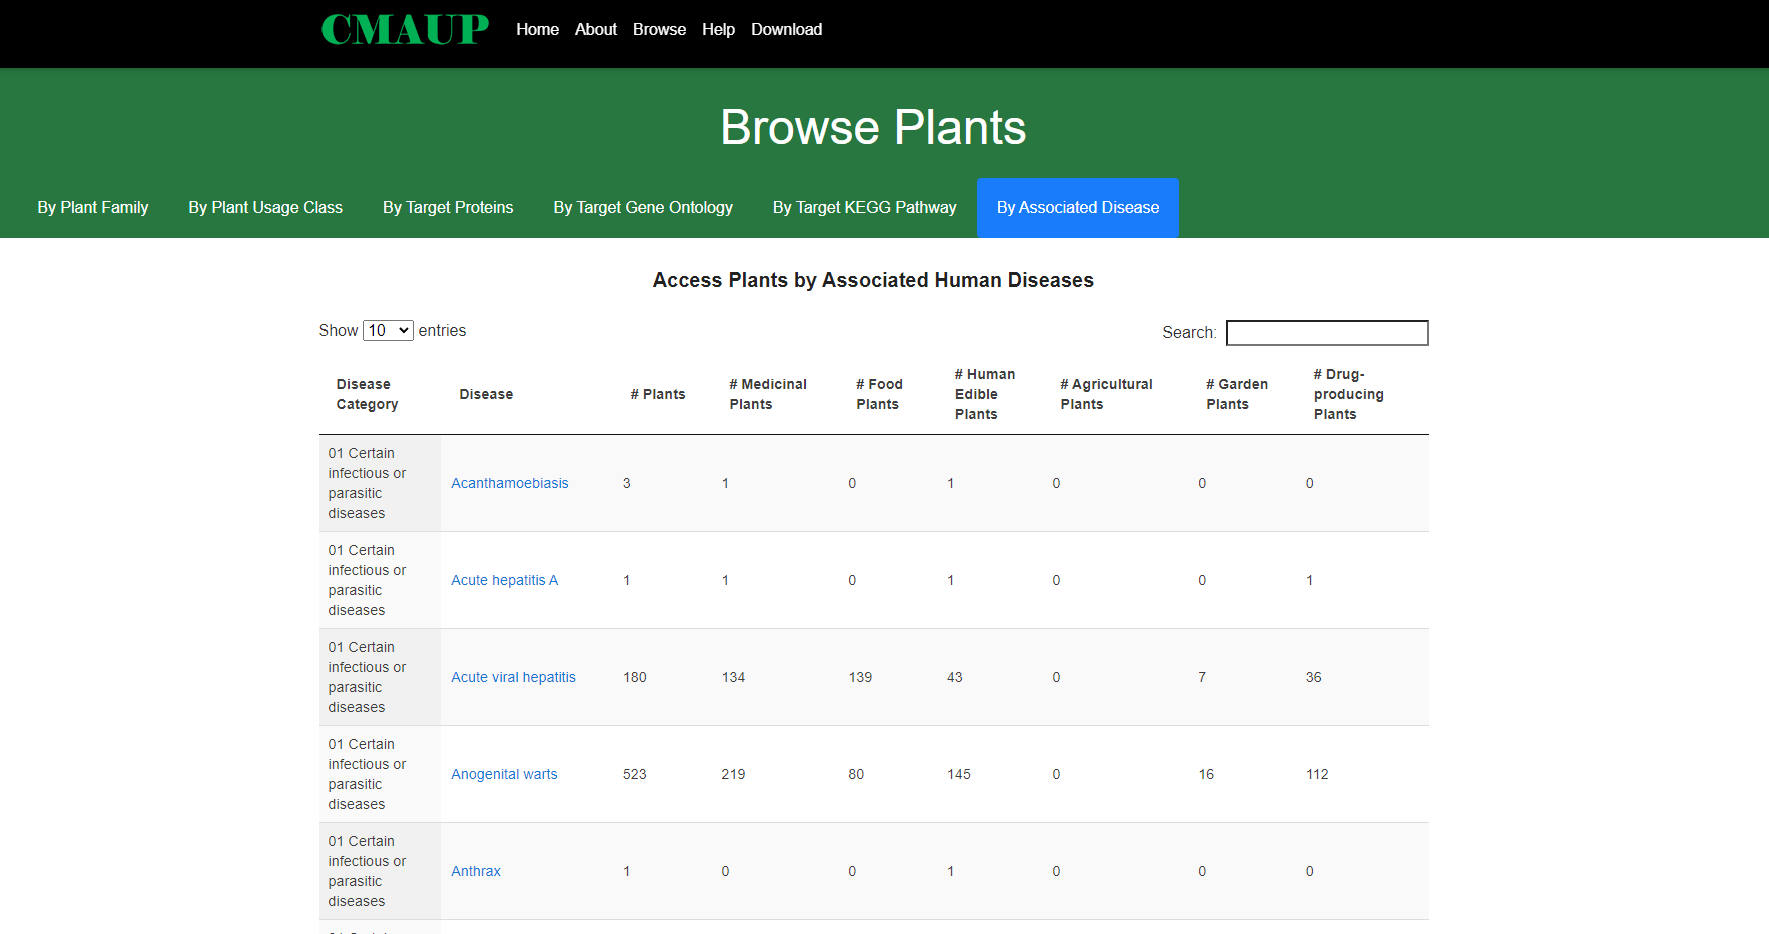
1.6. Browse CMAUP by related human disease
Plants are linked to human diseases via the targets. Diseases are categorized by the ICD-10 system. Users can access plants of a related human disease by clicking the disease name.
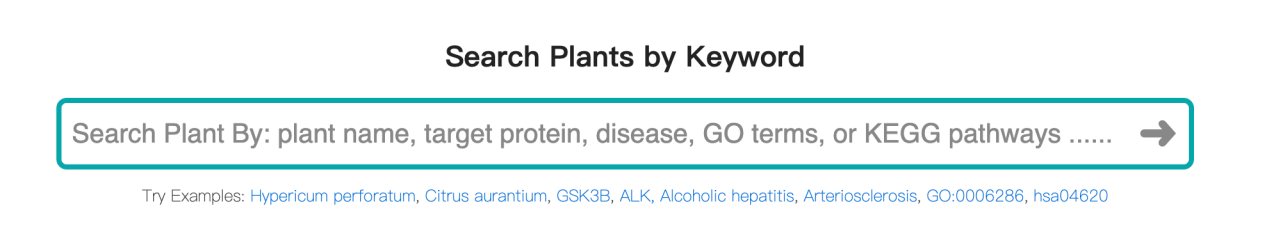
2. SEARCH BY KEYWORDS
Users can search plants by multiple type of keywords: plant name, target gene symbol/protein name, disease, GO term ID/name, and KEGG pathway.
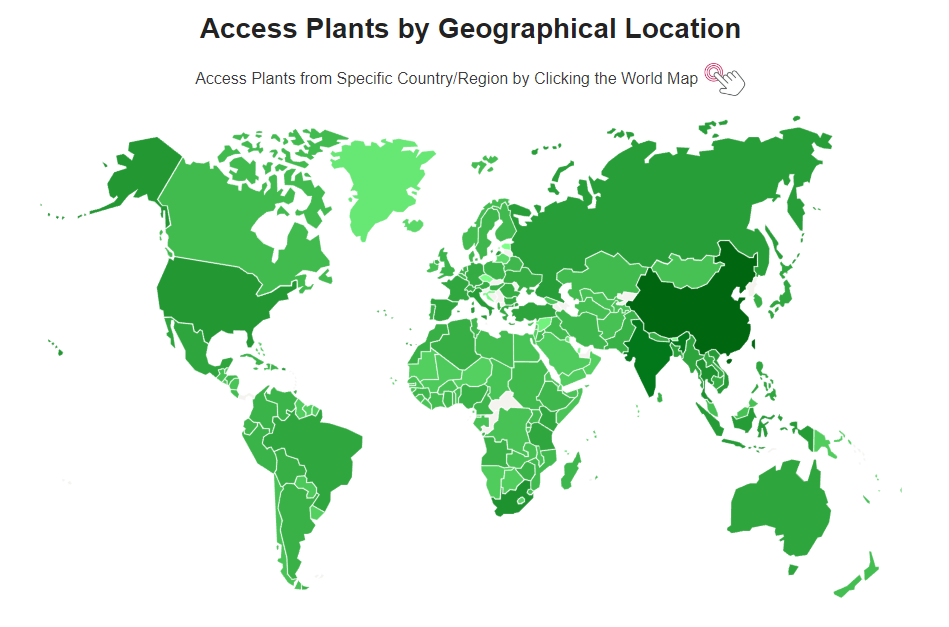
3. ACCESS PLANTS BY WORLD MAP
Users can click country/region on the world map to access related plants.
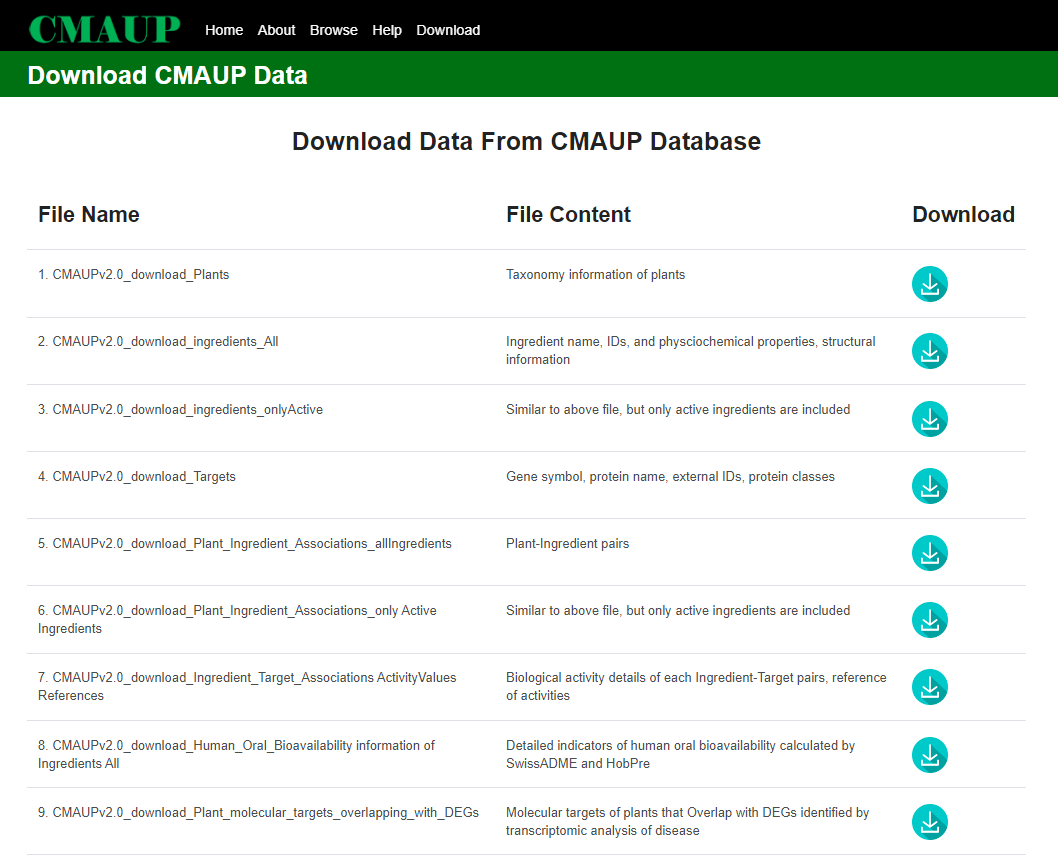
4. DOWNLOAD DATA
All data can be freely downloaded at each individual webpage.
5. WEBPAGE OF A SPECIFIC PLANT
A typical example of plant page is shown below:
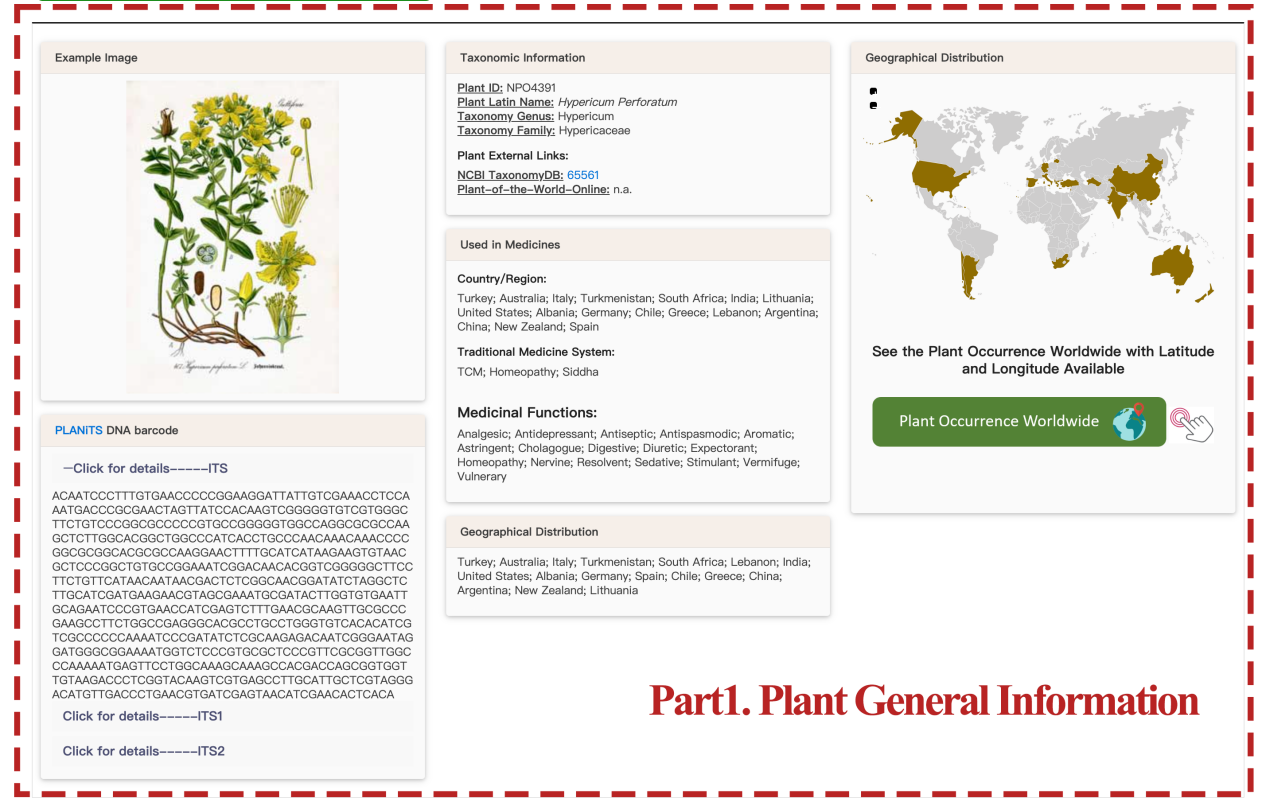
Part 1. Plant General Information Section:
In this section, the taxonomy information (species, genus, and family names) was provided, a link to NCBI Taxonomy Database was provided if available. Moreover, countries/regions or traditional medicine system where use the plant as medicinal herbs are listed if available. Geographic distribution of the plant is provided along with a highlighted world map. An example image of the plant will be displayed when available.
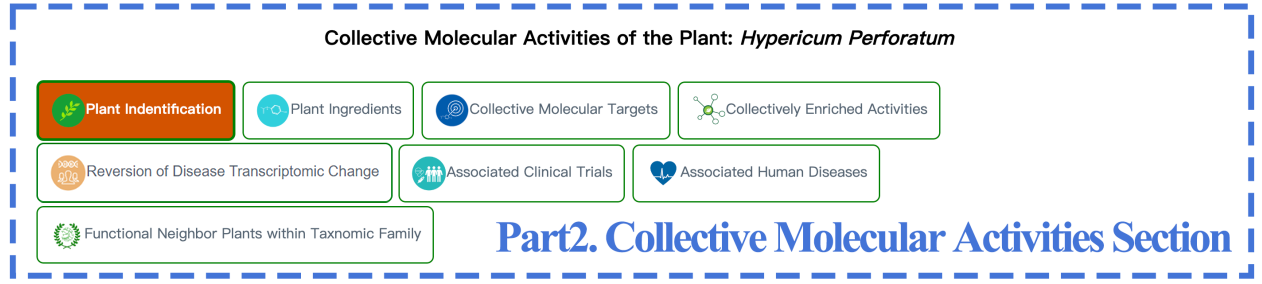
Part 2. Collective Molecular Activities Section:
This section includes “Plant Ingredients”, “Collective Molecular Targets”, “Collectively Enriched Activities”, “Reversion of Disease Transcriptomic Change”, and “Associated Clinical Trails”, “Associated Human Diseases”, “Functional Neighbor Plants within Taxonomic Family” subsections.
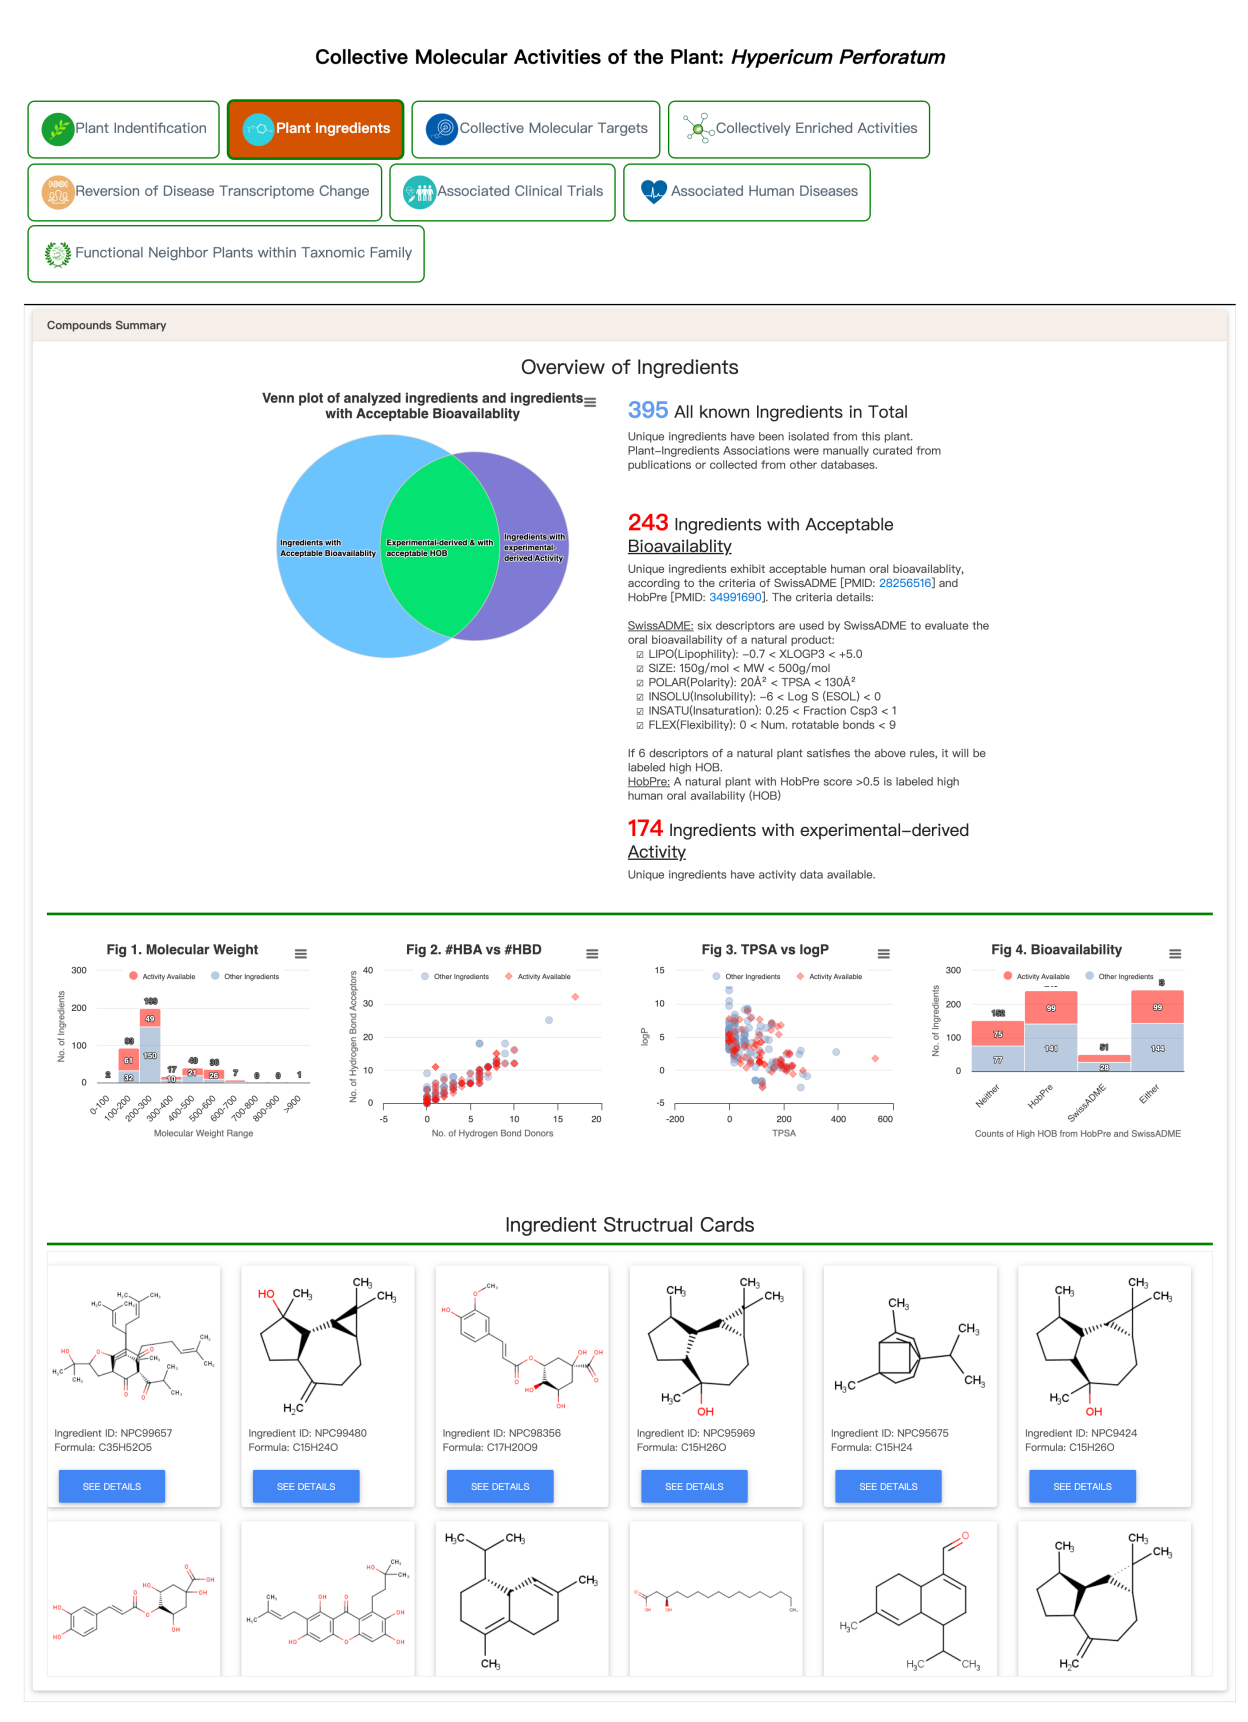
A. Plant ingredients
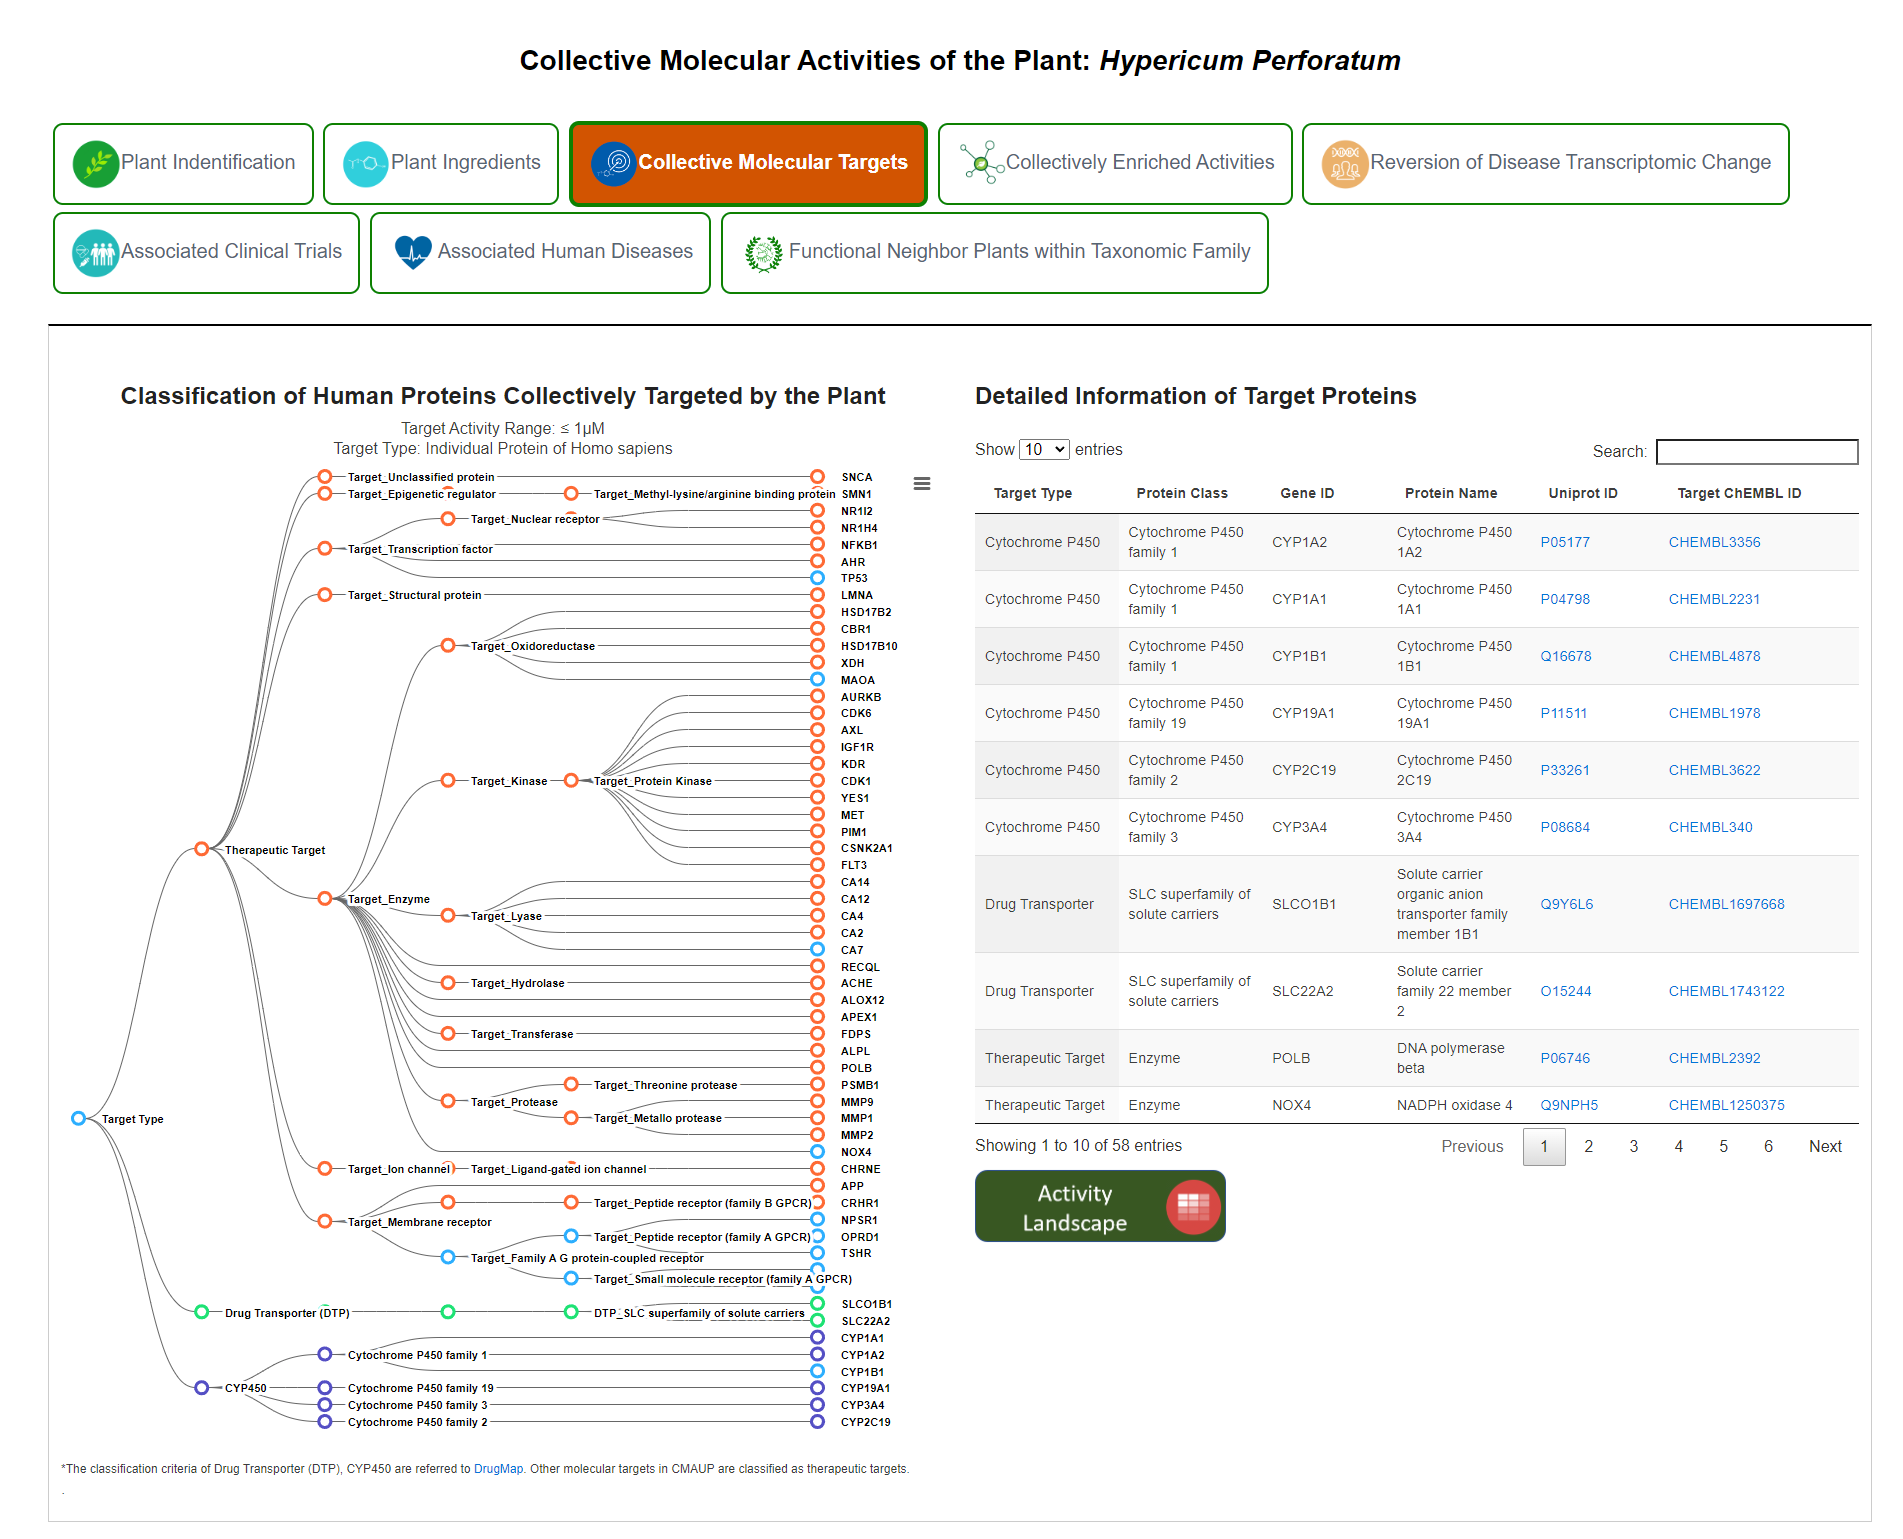
B. Collective molecular targets
Collective molecular targets consist of two parts. The figure on the left shows Classification of Human Proteins Collectively Targeted by the Plant. The table on the right shows detailed information of target proteins.
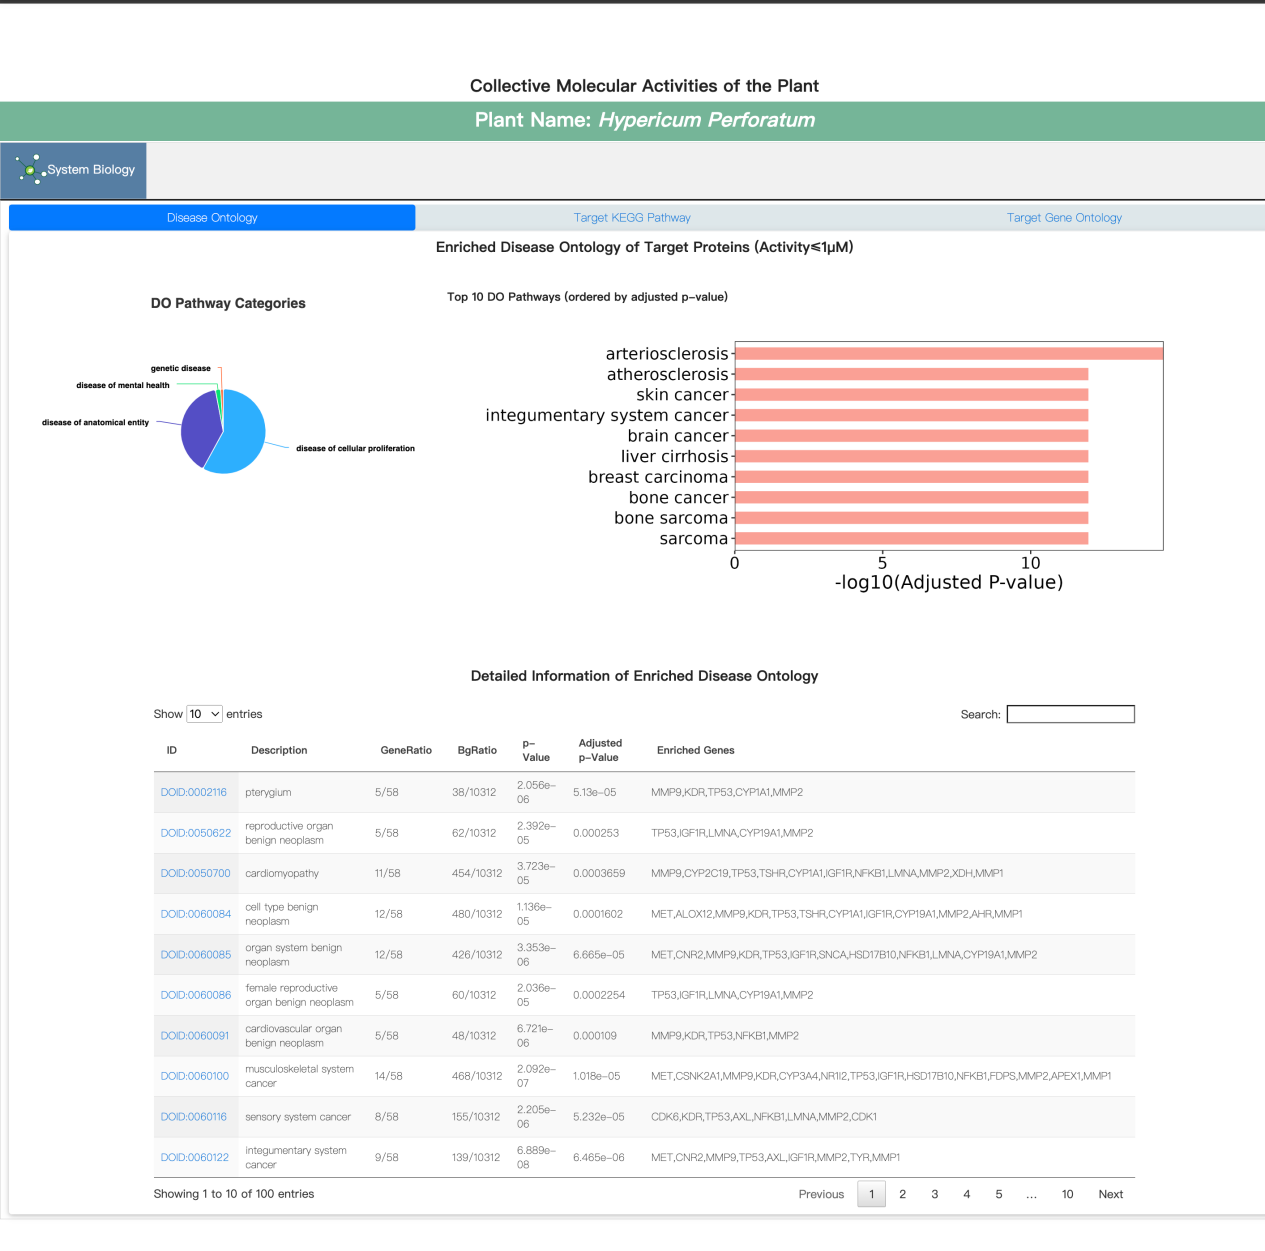
C. Collectively Enriched Activities
In this subsection, we provide information about disease ontology, target KEGG pathway and target gene ontology.
D. Reversion of Disease Transcriptomic Change
In this subsection, we provide information about reversion of disease transcriptional changes. CMAUP includes 1,152 molecular targets of 5,765 plants overlapping with differentially expressed genes that were identified from 20,027 samples covering 74 diseases.
(1)DEG Analysis (shown in boxplot)
The R package of Combat-seq was used to remove batch effects. DEGs were identified using R package DESeq2 with the cutoff of | log2(fold change) | > 1.5 and adjusted P-value <0.001.
(2)Rank Biased Overlap (RBO) (shown in volcano plot)
We calculate RBO (Webber et al., 2010) of each plant and disease using the list of up-regulated gene and targets of plant (<1μM). The formula for calculating RBO was referred to DOI:10.1145/1852102.1852106. An online calculating tool was also provide for users to calculate the RBOs of their interested diseases using the target list within CMAUP.
Besides, we make a RBO calculating tool available for users who want to calculate RBO based on data provided.

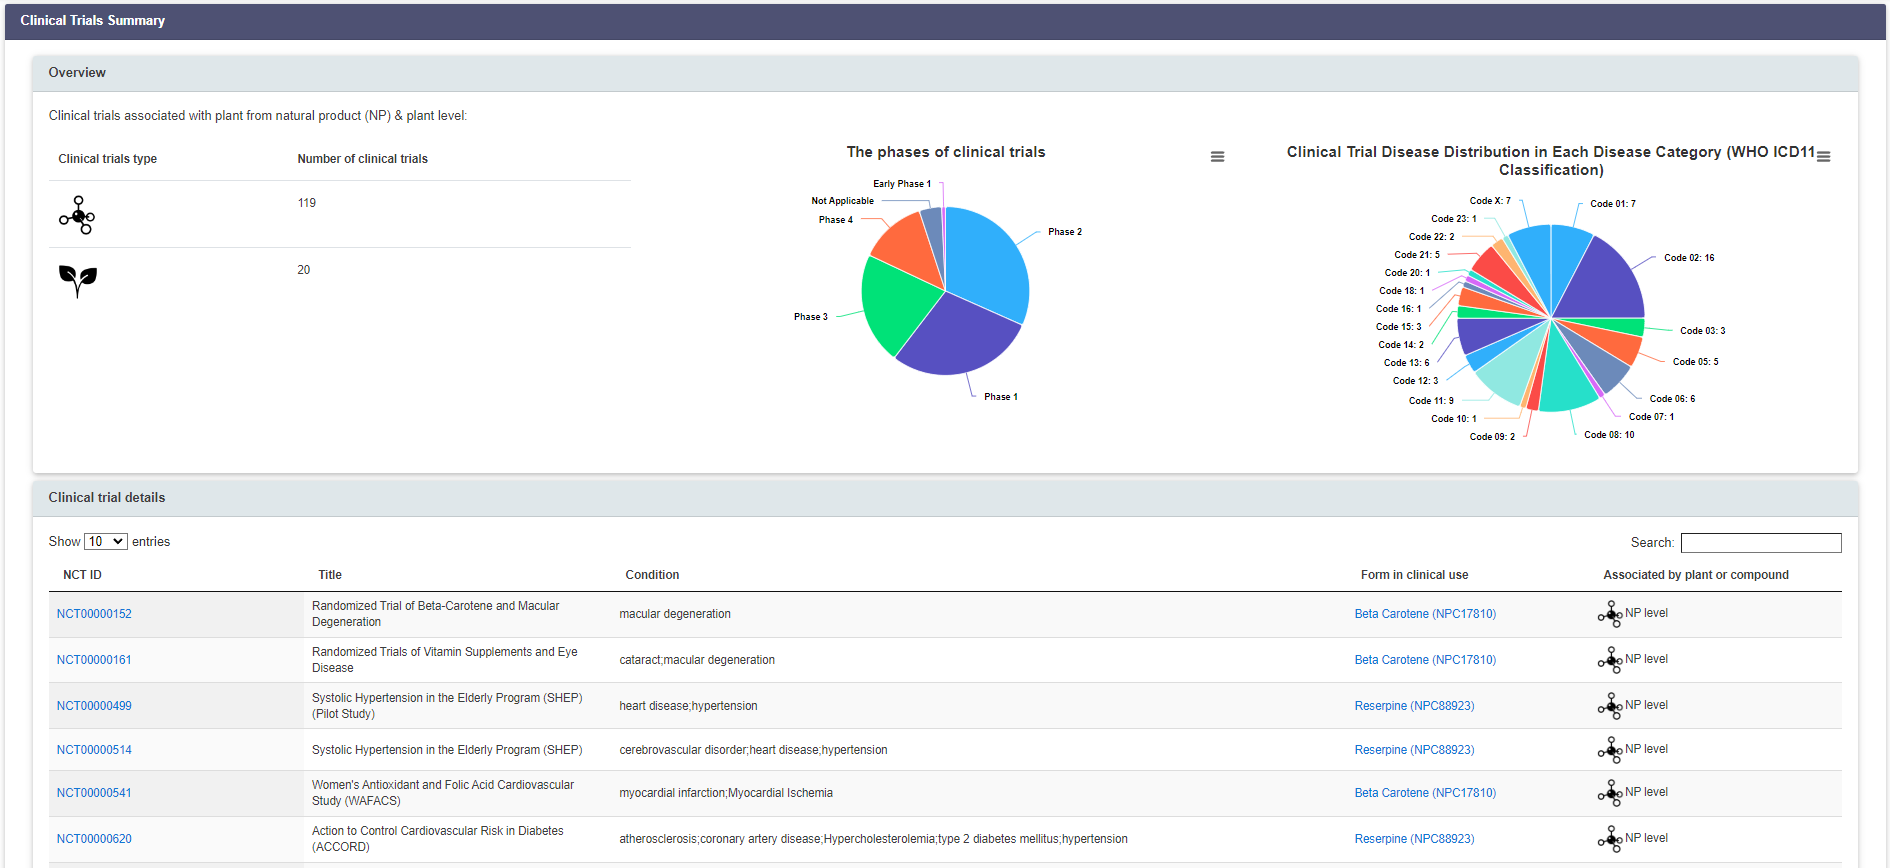
E. Associated Clinical Trials
In this subsection, we provide the clinical trial data associated with plants and natural products. Table below provide detailed information about clinical trials.
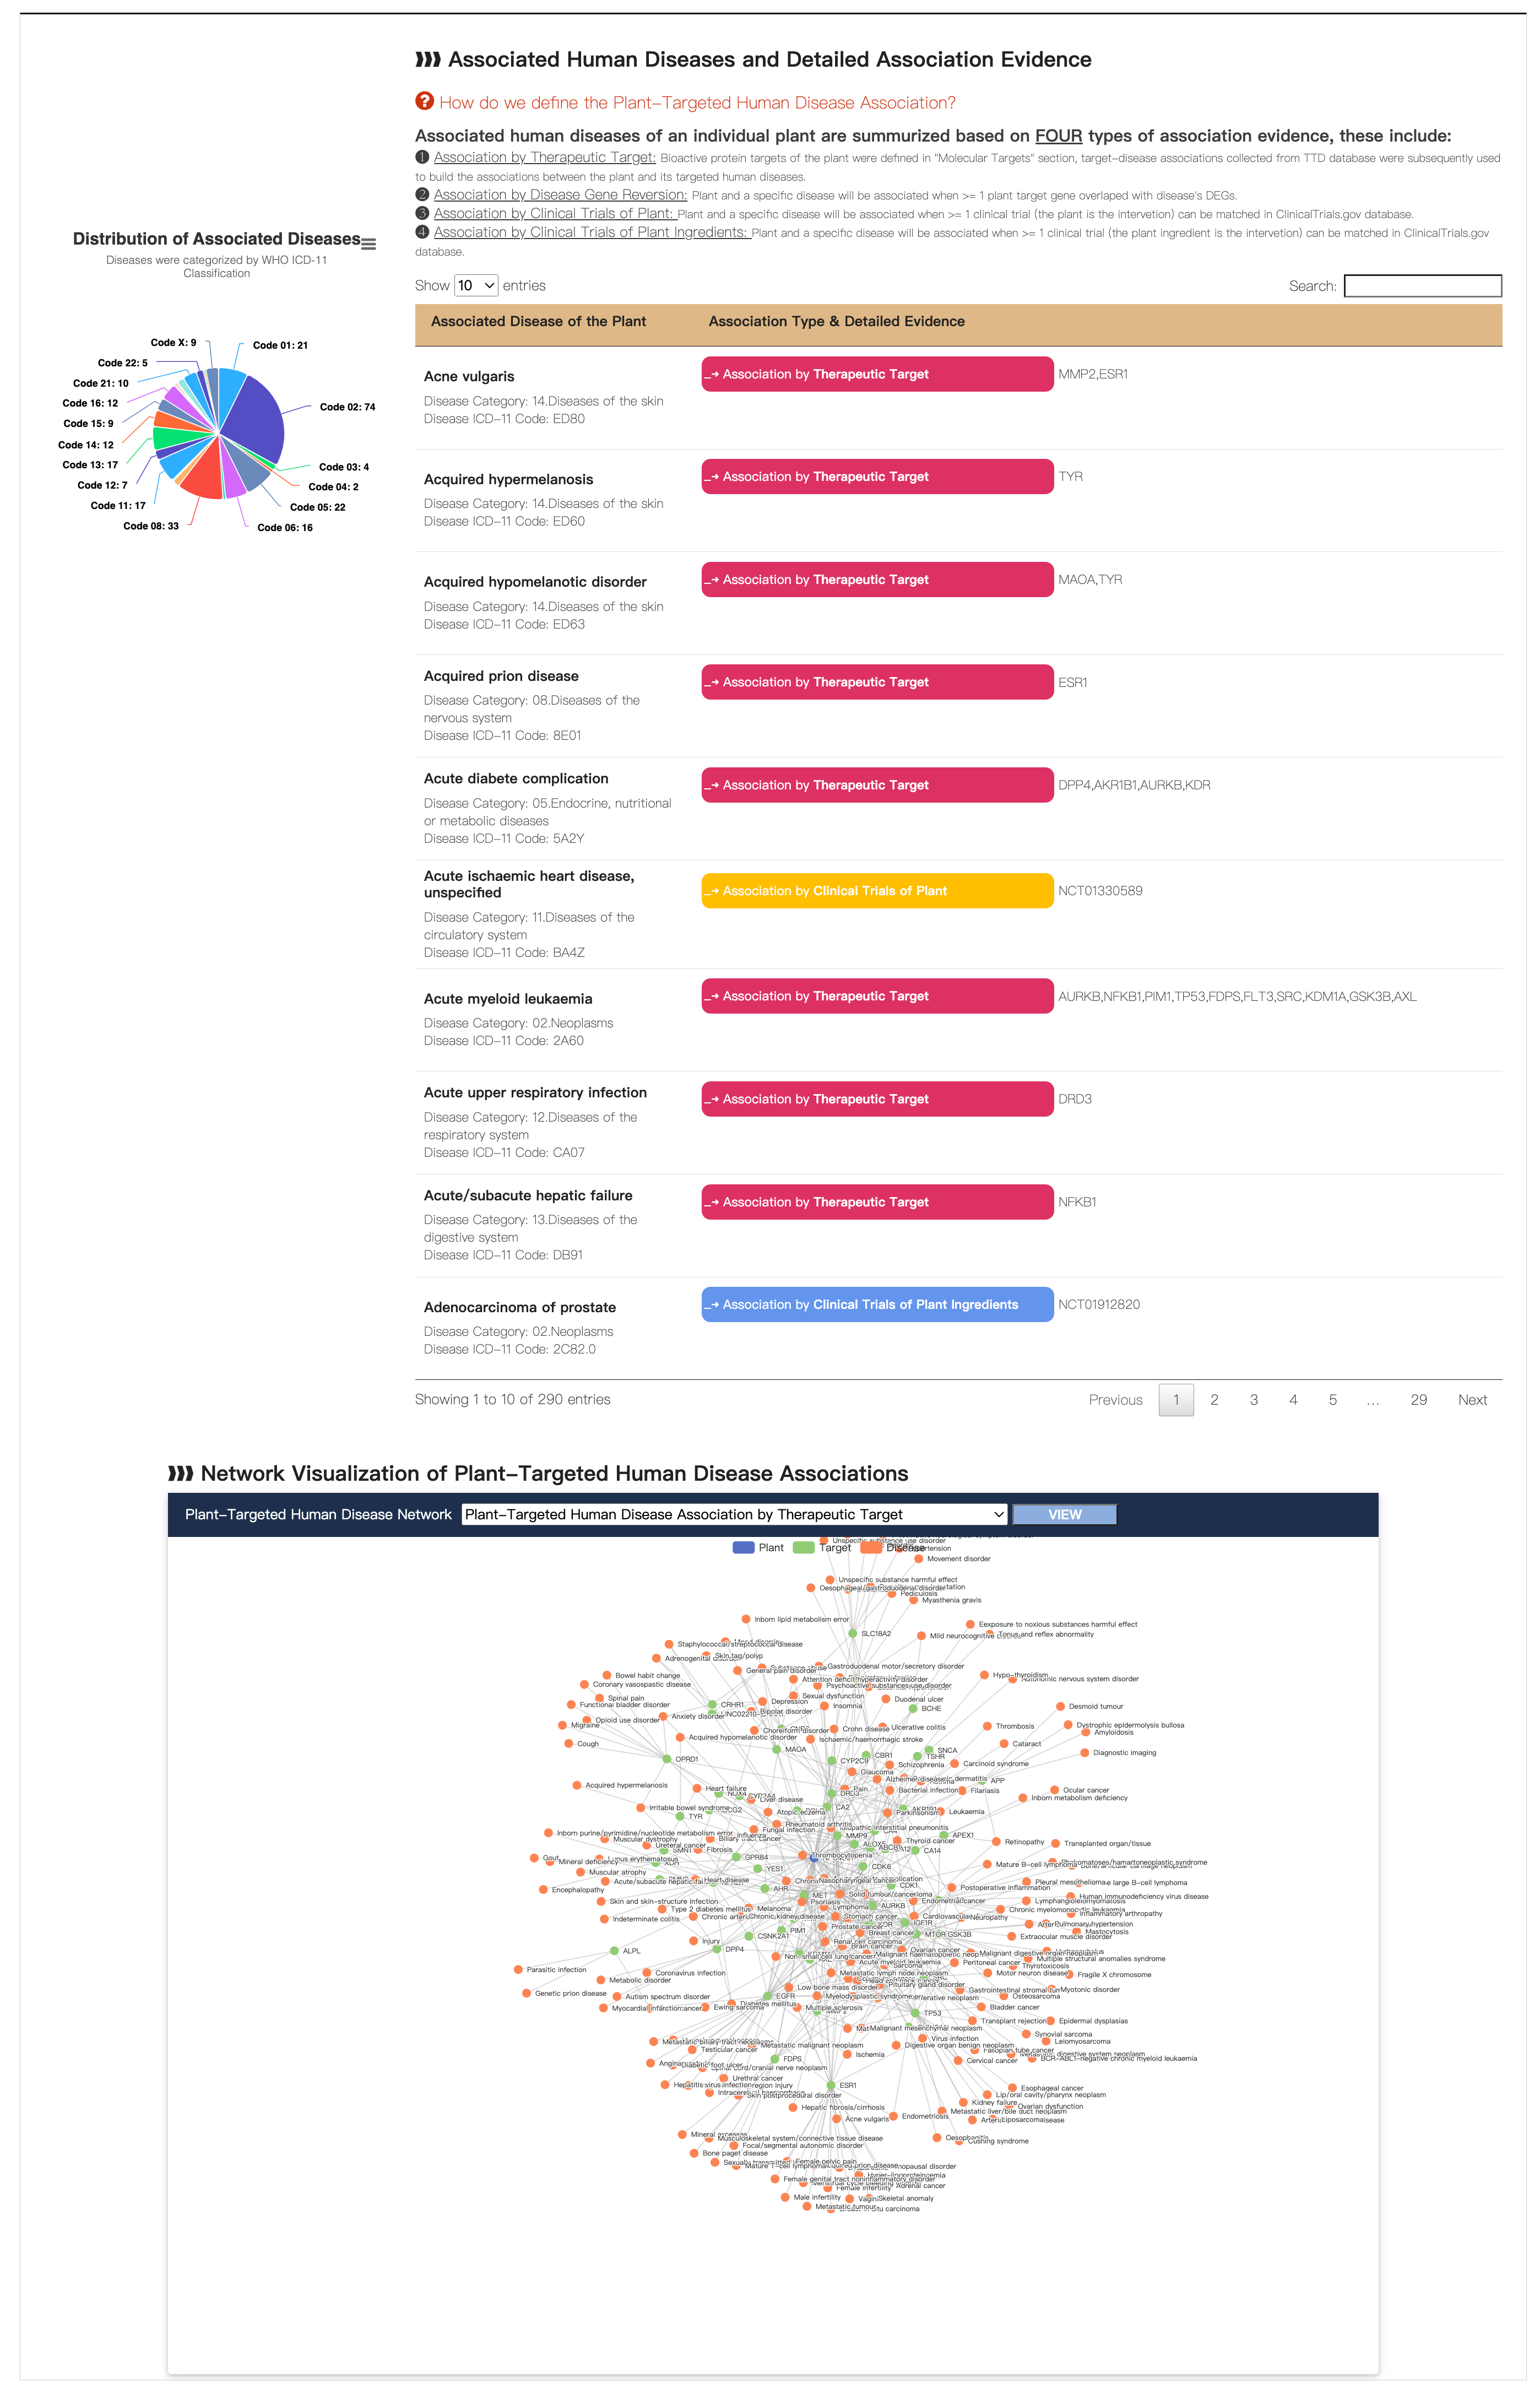
F. Associated Human Disease
In this subsection, we provide information about Functional Neighbor Plants within Taxonomic Family. Associated human diseases of an individual plant are summarized based on FOUR types of association evidence, these include: Plant and human disease associations for 428,737 associations by therapeutic target, 220,935 associations by reversion of transcriptomic change in targeted human populations, 723 associations by clinical trials of individual plants, and 154,121 associations by clinical trials of plant ingredients.
To make better use of the data collected, we implement a network visualization plot to display the Plant-Target Human Disease associations.
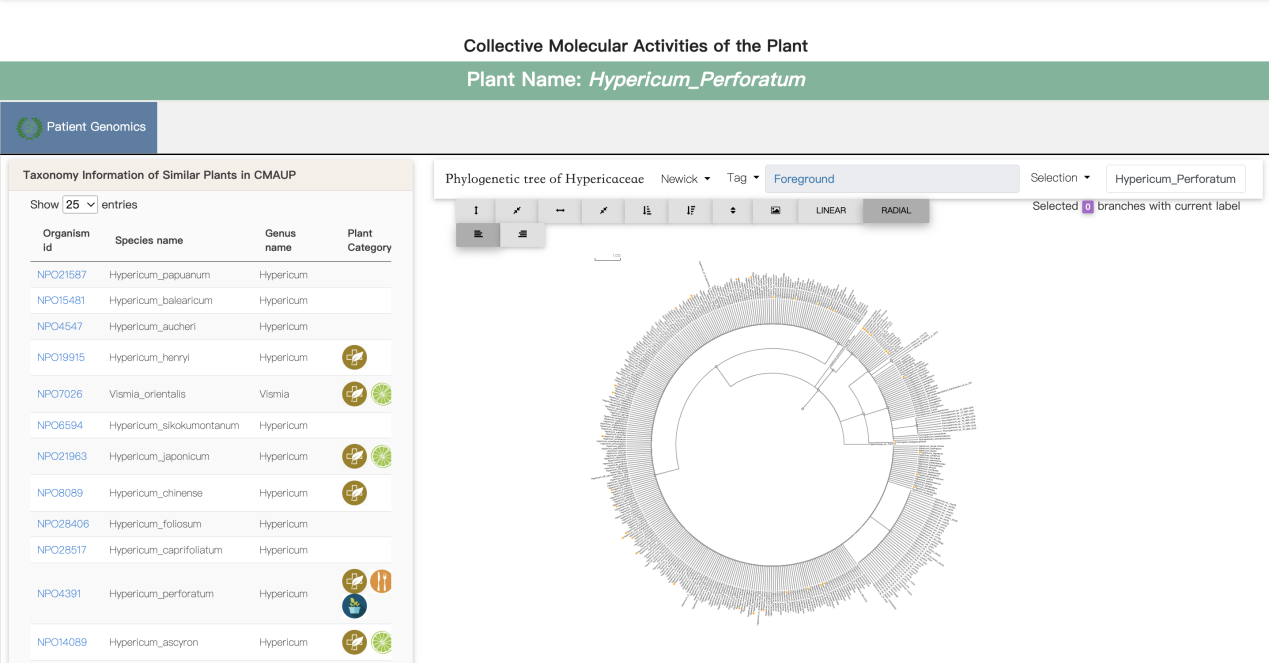
G. Functional Neighbor Plants with Taxonomy Family
This page provides information about patient genomics in the phylogenetic tree form. The location of all individual plants in the phylogenetic tree for navigating taxonomic neighbors. Phylogenetic tree projection of individual plants at family level to allow the overview of the distribution of bioactive plants from the phylogenetic view. We used phyloT (https://phylot.biobyte.de/) to generate phylogenetic tree for 372 families and labeled other relevant plant species or genera in CMAUP.
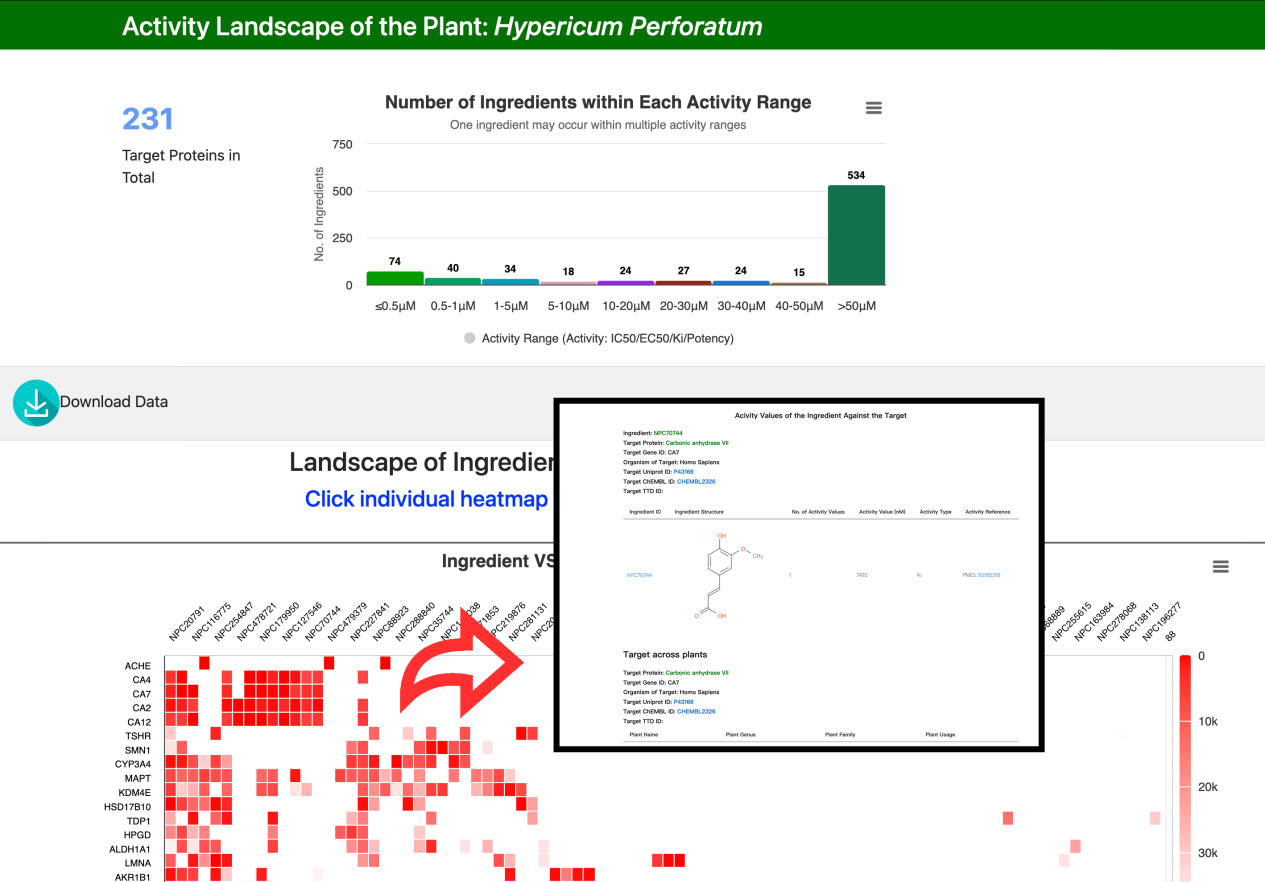
6. WEBPAGE OF PLANT’S BIOLOGICAL ACTIVITY LANDSCAPE
To show the activity landscape of all ingredients of a plant, lower activity value means stronger activity and coloured with the darker red in the heatmap.
Clicking the heatmap cells can view detailed activity of certain ingredient against a specific target protein.
Moreover, users can download all the activity values in the “Download Data” subsection.