 Natural Product: NPC480926
| Natural Product ID | NPC480926 |
|
Common Name
The InCHIKey will be temporarily assigned as the "Common Name" if no IUPAC name or alternative short name is available.
| JILITSUGMYISKM-YOMVXEAQSA-N |
| IUPAC Name | n.a. |
| Synonyms | |
| Synthetic Gene Cluster | n.a. |
| ChEMBL Identifier | n.a. |
| PubChem CID | n.a. |
| Chemical Classification |
|
The Chemical Classification was calculated by Classyfire, a software for chemical taxonomy calculation. Reference: DOI:10.1186/s13321-016-0174-y.
 Chemical Representations
| Standard InCHIKey | JILITSUGMYISKM-YOMVXEAQSA-N |
| Standard InCHI | InChI=1S/C29H44O4/c1-24(2)20-9-12-27(5)21(26(20,4)11-10-22(24)31)8-7-18-19-15-25(3,17-30)13-14-29(19,33)23(32)16-28(18,27)6/h7,19-21,30,33H,8-17H2,1-6H3/t19-,20-,21+,25?,26-,27+,28+,29+/m0/s1 |
| SMILES | CC1(C)[C@@H]2CC[C@]3(C)[C@H](CC=C4[C@@H]5CC(C)(CC[C@@]5(C(=O)C[C@@]34C)O)CO)[C@@]2(C)CCC1=O |
 Calculated Properties
Physi-Chem Properties
| Molecular Weight: | 456.32 | Volume: | 494.609 Van der Waals volume.
|
| Dense: | 0.923 | LogP: | 3.131 The logarithm of the n-octanol/water distribution coefficients.
|
| logD7.4: | 3.195 The logarithm of the n-octanol/water distribution coefficient at pH=7.4.
|
LogS: | -4.309 The logarithm of aqueous solubility value.
|
| Rotatable Bonds: | 1.0 | Rigid Bonds: | 28.0 |
| TPSA: | 74.6 Topological Polar Surface Area.
|
H-Bond Acceptor: | 4.0 |
| H-Bond Donor: | 2.0 | Rings: | 5.0 |
| Heavy Atoms: | 4.0 |
MedChem Properties
| QED Drug-Likeness Score: | 0.528 | GASA: | 1.0 GASA represents the probability of being difficult to synthesize, ranging from 0 to 1.
|
| Synthetic Accessibility Score: | 5.035 | Fsp3: | 0.862 |
| MCE-18: | 104.0 MCE-18 stands for medicinal chemistry evolution.MCE-18≥45 is considered a suitable value.
|
Lipinski Rule-of-5: | Rejected |
| Pfizer Rule: | Accepted | GSK Rule: | Accepted |
| Golden Triangle Rule: | Rejected | BMS Rule: | 0 |
| Chelating Alert: | 0 | PAINS Alert: | 0 |
| Colloidal aggregators: | 0.568 | Fluc inhibitor: | 0.0 The fluc inhibitor value is the probability of being fLuc inhibitors, within the range of 0 to 1.
|
| Blue fluorescence: | 0.005 The blue fluorescence value is the probability of being blue fluorescence, within the range of 0 to 1
|
Green fluorescence: | 0.002 The green fluorescence value is the probability of being green fluorescence, within the range of 0 to 1
|
| Reactive compounds: | 0.442 | Promiscuous compounds: | 0.586 |
ADMET Properties (ADMETlab3.0)
ADMET: Absorption
| Caco-2 Permeability: | -5.24 | MDCK Permeability: | -5.0 |
| Pgp-inhibitor: | 0.234 | Pgp-substrate: | 0.011 |
| PAMPA: |
0.997 The experimental data for Peff was logarithmically transformed (logPeff). Molecules with log Peff values below 2.0 were classified as low-permeability (Category 0), while those with log Peff values exceeding 2.5 were classified as high-permeability (Category 1).
|
Human Intestinal Absorption (HIA): | 0.001 |
| 20% Bioavailability (F20%): | 0.286 | 30% Bioavailability (F30%): | 0.452 |
| 50% Bioavailability (F50%): | 0.999 |
ADMET: Distribution
| Blood-Brain-Barrier Penetration (BBB): | 0.223 | MRP1: | 0.925 |
| Plasma Protein Binding (PPB): | 90.733% | Volume Distribution (VD): | 0.137 |
| Fu: |
10.398% The fraction unbound in plasms.
|
OATP1B1 inhibitor: | 1.0 |
| OATP1B3 inhibitor: | 0.993 | BCRP inhibitor: | 0.252 |
| BSEP inhibitor: | 0.981 |
ADMET: Metabolism
| CYP1A2-inhibitor: | 0.995 | CYP1A2-substrate: | 0.0 |
| CYP2C19-inhibitor: | 0.839 | CYP2C19-substrate: | 0.009 |
| CYP2C9-inhibitor: | 0.031 | CYP2C9-substrate: | 0.0 |
| CYP2D6-inhibitor: | 0.0 | CYP2D6-substrate: | 0.13 |
| CYP3A4-inhibitor: | 0.995 | CYP3A4-substrate: | 0.12 |
| CYP2B6-substrate: | 0.0 | CYP2C8-inhibitor: | 0.663 |
| HLM stability: |
0.468 Human liver microsomal (HLM) stability. Category 0: stable+ (HLM > 30 min); Category 1: unstable- (HLM ≤ 30 min). The output value is the probability of human liver microsomal instability, where a value closer to 1 indicates a higher likelihood of instability.
|
ADMET: Excretion
| Clearance (CL): | 7.925 | Half-life (T1/2): | 0.737 |
ADMET: Toxicity
| hERG Blockers: | 0.026 | hERG Blockers (10um): | 0.085 |
| Human Hepatotoxicity (H-HT): | 0.703 | Drug-induced Liver Injury (DILI): | 0.198 |
| AMES Toxicity: | 0.53 | Rat Oral Acute Toxicity: | 0.427 |
| Maximum Recommended Daily Dose: | 0.482 | Skin Sensitization: | 0.879 |
| Carcinogencity: | 0.941 | Eye Corrosion: | 0.003 |
| Eye Irritation: | 0.283 | Respiratory Toxicity: | 0.565 |
| Drug-induced Neurotoxicity: | 0.279 | Ototoxicity: | 0.537 |
| Hematotoxicity: | 0.707 | Drug-induced Nephrotoxicity: | 0.917 |
| Genotoxicity: | 0.94 | RPMI-8226 Immunitoxicity: | 0.079 |
| A549 Cytotoxicity: | 0.325 | Hek293 Cytotoxicity: | 0.498 |
| BCF: |
0.882 Bioconcentration factors are used for considering secondary poisoning potential and assessing risks to human health via the food chain. The unit is -log10[(mg/L)/(1000*MW)].
|
IGC50: |
3.362 48 hour Tetrahymena pyriformis IGC50. The unit of IGC50 is -log10[(mg/L)/(1000*MW)].
|
| LC50DM: |
4.853 48 hour Daphnia magna LC50. The unit of LC50DM is -log10[(mg/L)/(1000*MW)].
|
LC50FM: |
4.211 96 hour fathead minnow LC50. The unit of LC50FM is -log10[(mg/L)/(1000*MW)].
|
 Species Source
| Organism ID | Organism Name | Taxonomy Level | Family | SuperKingdom | Isolation Part | Collection Location | Collection Time | Reference |
|---|---|---|---|---|---|---|---|---|
| NPO23380 | Camellia japonica | Species | Theaceae | Eukaryota | n.a. | leaf | n.a. |
PMID[16926516] |
| NPO23380 | Camellia japonica | Species | Theaceae | Eukaryota | flower buds | n.a. | n.a. |
PMID[22834923] |
| NPO23380 | Camellia japonica | Species | Theaceae | Eukaryota | Roots | n.a. | n.a. |
PMID[30395460] |
| NPO23380 | Camellia japonica | Species | Theaceae | Eukaryota | n.a. | n.a. | n.a. |
PMID[32569471] |
| NPO23380 | Camellia japonica | Species | Theaceae | Eukaryota | n.a. | n.a. | n.a. |
PMID[39065796] |
| NPO23380 | Camellia japonica | Species | Theaceae | Eukaryota | n.a. | n.a. | n.a. | Database[COCONUT] |
| NPO23380 | Camellia japonica | Species | Theaceae | Eukaryota | n.a. | n.a. | n.a. | Database[HerDing] |
| NPO23380 | Camellia japonica | Species | Theaceae | Eukaryota | n.a. | n.a. | n.a. | Database[TCMID] |
| NPO23380 | Camellia japonica | Species | Theaceae | Eukaryota | n.a. | n.a. | n.a. | Database[TCM_Taiwan] |
| NPO23380 | Camellia japonica | Species | Theaceae | Eukaryota | n.a. | n.a. | n.a. | Database[UNPD] |
Note for Reference:
In addition to directly collecting NP source organism data from primary literature (where reference will provided as NCBI PMID or DOI links), NPASS also integrated them from below databases:
☉ UNPD: Universal Natural Products Database [PMID: 23638153].
☉ StreptomeDB: a database of streptomycetes natural products [PMID: 33051671].
☉ TM-MC: a database of medicinal materials and chemical compounds in Northeast Asian traditional medicine [PMID: 26156871].
☉ TCM@Taiwan: a Traditional Chinese Medicine database [PMID: 21253603].
☉ TCMID: a Traditional Chinese Medicine database [PMID: 29106634].
☉ TCMSP: The traditional Chinese medicine systems pharmacology database and analysis platform [PMID: 24735618].
☉ HerDing: a herb recommendation system to treat diseases using genes and chemicals [PMID: 26980517].
☉ MetaboLights: a metabolomics database [PMID: 27010336].
☉ FooDB: a database of constituents, chemistry and biology of food species [www.foodb.ca].
 NP Quantity Composition/Concentration
| Organism ID | Organism Name | Organism Material Preparation | Organism Part | NP Quantity (Standard) | NP Quantity (Minimum) | NP Quantity (Maximum) | Quantity Unit | Reference |
|---|
Note for Reference:
In addition to directly collecting NP quantitative data from primary literature (where reference will provided as NCBI PMID or DOI links), NPASS also integrated NP quantitative records for specific NP domains (e.g., NPS from foods or herbs) from domain-specific databases. These databases include:
☉ DUKE: Dr. Duke's Phytochemical and Ethnobotanical Databases.
☉ PHENOL EXPLORER: is the first comprehensive database on polyphenol content in foods [PMID: 24103452], its homepage can be accessed at here.
☉ FooDB: a database of constituents, chemistry and biology of food species [www.foodb.ca].
 Biological Activity
Molecular-level activity
| Target ID | Target Type | Target Name | Target Organism | Activity Type | Activity Relation | Value | Unit | Reference |
|---|---|---|---|---|---|---|---|---|
| NPT740 | Individual protein | Beta-secretase 1 | Homo sapiens | Inhibition | = | 60.56 | % | PMID[32569471] |
In vitro activity
| Target ID | Target Type | Target Name | Target Organism | Activity Type | Activity Relation | Value | Unit | Reference |
|---|---|---|---|---|---|---|---|---|
| NPT804 | Cell line | HT-22 | Mus musculus | FC | = | 1.81 | n.a. | PMID[32569471] |
| NPT804 | Cell line | HT-22 | Mus musculus | Activity | = | 81.2 | % | PMID[32569471] |
In vivo activity
| Target ID | Target Type | Target Name | Target Organism | Activity Type | Activity Relation | Value | Unit | Reference |
|---|
 Experimental ADME
| Experiment Model | Experiment Tissue | ADME Type | ADME Relation | ADME Value | ADME Unit | Reference |
|---|
 Experimental Toxicity
Quantitative toxicity
| Experiment Model | Experiment Organism | Toxicity Type | Toxicity Relation | Toxicity Value | Toxicity Unit | Reference |
|---|
Common Abbreviations:
LC: Lethal Concentration; LD: Lethal Dose; LT:Lethal Time; NOAEL: No-observed-adverse-effect Level; BMDL: Benchmark Dose Lower Confidence Limit; BMD: Benchmark Dose; BMC:Benchmark Concentration; LOAEL: Lowest Observed Adverse Effect Level; RfD:Reference Dose; RfC:Reference Concentration; MRL: Minimal Risk Level; MEG: Maximum Exposure Guideline; PAC: Protective Action Criteria
Categorical toxicity labels
| Hepatotoxicity | Carcinogenicity | Mutagenicity | Cardiotoxicity | Respiratory Toxicity | Eye Irritation | Endocrine Disruption |
|---|---|---|---|---|---|---|

|

|

|

|

|

|

|
Note for Reference:
In addition to directly collecting NP quantitative data from primary literature (where reference will provided as NCBI PMID or DOI links), NPASS also integrated NP toxicity records from domain-specific databases. These databases include:
☉ ToxValDB: a curated database that compiles quantitative toxicity values for chemicals from diverse public sources to support toxicological research and risk assessment.
☉ TOXRIC: a comprehensive, free-to-access, online database providing toxicological/feature data. The toxicity labels are retrieved from this database. [PMID: 36400569]
 Chemically structural similarity
Similar Active Natural Products in NPASS
Top-200 similar NPs were calculated against the active-NP-set (includes approximately 50,000 NPs with experimentally-derived bioactivity available in NPASS)
Similarity is measured using the Tanimoto coefficient (Tc) , which compares the binary fingerprints of two molecules. Tc is calculated as the intersection divided by the union of '1' bits in the fingerprints, ranging from 0 to 1, with 1 indicating highest similarity.
● The left chart: Distribution of similarity level between NPC480926 and all remaining natural products in the NPASS database.
● The right table: Most similar natural products (Tc>=0.5 or Top200).
| Similarity Score | Similarity Level | Natural Product ID |
|---|---|---|
| 0.8333 | Intermediate Similarity | NPC80784 |
| 0.6765 | Remote Similarity | NPC480932 |
| 0.6479 | Remote Similarity | NPC480941 |
| 0.6389 | Remote Similarity | NPC480933 |
| 0.6087 | Remote Similarity | NPC2539 |
| 0.5735 | Remote Similarity | NPC3915 |
| 0.5405 | Remote Similarity | NPC480940 |
| 0.5211 | Remote Similarity | NPC133954 |
| 0.5147 | Remote Similarity | NPC142754 |
| 0.5147 | Remote Similarity | NPC82477 |
| 0.5067 | Remote Similarity | NPC38754 |
| 0.5063 | Remote Similarity | NPC480942 |
Similar Clinical/Approved Drugs
Similarity level is defined by Tanimoto coefficient (Tc) between two molecules.
● The left chart: Distribution of similarity level between NPC480926 and all drugs/candidates.
● The right table: Most similar clinical/approved drugs (Tc>=0.5 or Top200).
| Similarity Score | Similarity Level | Drug ID | Developmental Stage |
|---|---|---|---|
| NPD |
Bioactivity similarity
 Bioactivity similarity
Similar Natural Products in NPASS
Similarity level is defined by Bioactivity similarity was calculated based on bioactivity descriptors of compounds. The bioactivity descriptors were calculated by a recently developed AI algorithm Chemical Checker (CC) [Nature Biotechnology, 38:1087–1096, 2020; Nature Communications, 12:3932, 2021], which evaluated bioactivity similarities at five levels:
☉ A: chemistry similarity;
☉ B: biological targets similarity;
☉ C: networks similarity;
☉ D: cell-based bioactivity similarity;
☉ E: similarity based on clinical data.
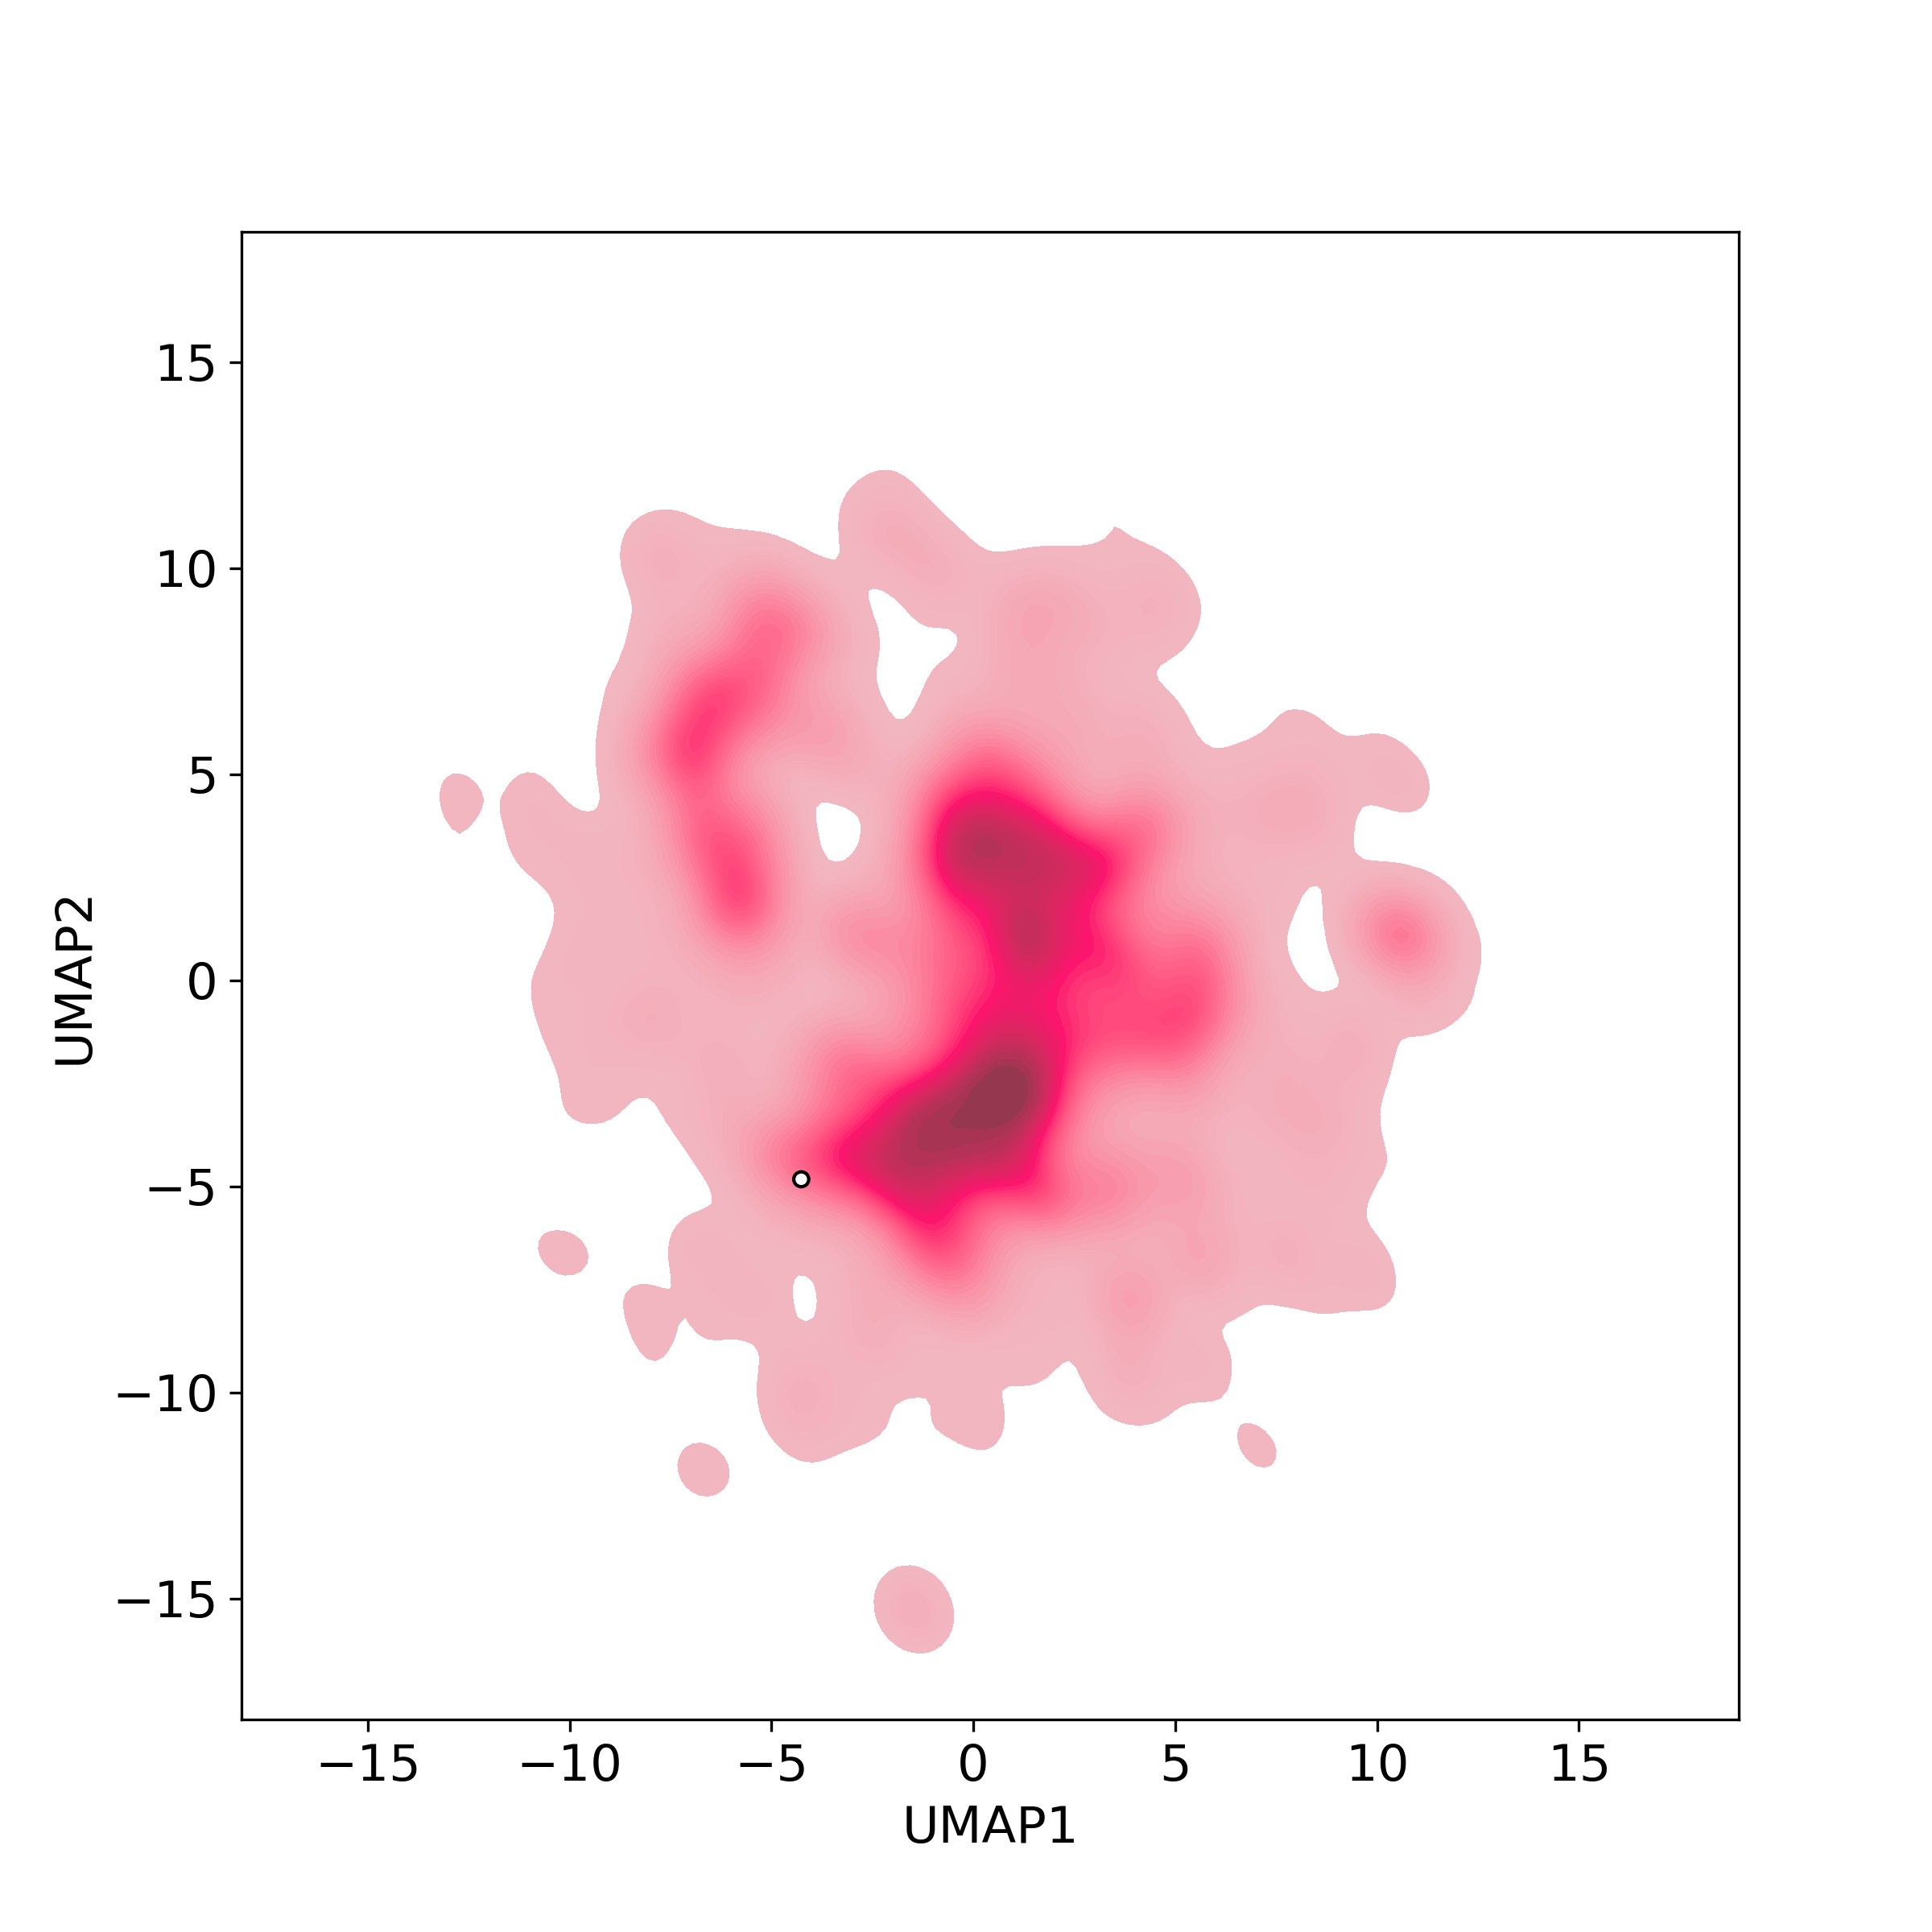
Those 5 categories of CC bioactivity descriptors were calculated and then subjected to manifold projection using UMAP algorithm, to project all NPs on a 2-Dimensional space. The current NP was highlighted with a small circle in the 2-D map. Below figures: left-to-right, A-to-E.