Predictive performance on these SVM, PNN, KNN are given in Sensitivity TP/(TP+FN), Specificity or Recall TN/(TN+FP), Precision TP/(TP + FP), Accuracy (TP+TN)/(TP+FN+TN+FP),
and MCC (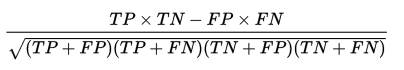 ).
).
| Protein family |
GO Category |
SVM | PNN | KNN | ||||||||||||
| Sensitivity (%) | Specificity (%) | Precision (%) | Accuracy (%) | MCC | Sensitivity (%) | Specificity (%) | Precision (%) | Accuracy (%) | MCC | Sensitivity (%) | Specificity (%) | Precision (%) | Accuracy (%) | MCC | ||
EC1.1 Oxidoreductases acting on the CH-OH group of donors |
GO:0016614 | 82.47 | 96.12 | 72.01 | 94.65 | 0.74 | - | - | - | - | - | - | - | - | - | - |
EC1.2 Oxidoreductases acting on the aldehyde or oxo group of donors |
GO:0016903 | 78.96 | 98.46 | 77.08 | 97.25 | 0.77 | - | - | - | - | - | - | - | - | - | - |
EC1.3 Oxidoreductases acting on the CH-CH group of donors |
GO:0016627 | 66.36 | 98.86 | 56.15 | 98.16 | 0.60 | 74.92 | 99.08 | 96.38 | 93.12 | 0.81 | 86.82 | 91.09 | 75.49 | 90.07 | 0.74 |
EC1.4 Oxidoreductases acting on the CH-NH2 group of donors |
GO:0016638 | 65.79 | 99.48 | 65.79 | 98.98 | 0.66 | 77.28 | 99.21 | 94.15 | 96.11 | 0.83 | 92.46 | 93.79 | 70.24 | 93.61 | 0.77 |
EC1.5 Oxidoreductases acting on the CH-NH group of donors |
GO:0016645 | 58.57 | 99.58 | 66.13 | 99.01 | 0.62 | 64.18 | 99.17 | 92.55 | 94.32 | 0.74 | 84.45 | 95.84 | 75.95 | 94.31 | 0.77 |
EC1.6 Oxidoreductases acting on NADH or NADPH |
GO:0016651 | 94.51 | 98.24 | 92.7 | 97.52 | 0.92 | - | - | - | - | - | - | - | - | - | - |
EC1.7 Oxidoreductases acting on other nitrogenous compounds as donors |
GO:0016661 | 65.91 | 99.74 | 69.05 | 99.45 | 0.67 | - | - | - | - | - | - | - | - | - | - |
EC1.8 Oxidoreductases acting on a sulfur group of donors |
GO:0016667 | 58.82 | 99.6 | 66.67 | 99.05 | 0.62 | - | - | - | - | - | 90.35 | 95.14 | 82.03 | 94.2 | 0.82 |
EC1.9 Oxidoreductases acting on a heme group of donors |
GO:0016675 | 99.26 | 99.04 | 99.01 | 99.15 | 0.98 | - | - | - | - | - | - | - | - | - | - |
EC1.10 Oxidoreductases acting on diphenols and related substances as donors |
GO:0016679 | 76.47 | 99.4 | 68.42 | 99.02 | 0.72 | 84.99 | 99.48 | 90.51 | 98.68 | 0.87 | 88.45 | 99.5 | 90.93 | 98.91 | 0.89 |
EC1.11 Oxidoreductases acting on a peroxide as acceptor |
GO:0016684 | 86.9 | 99.56 | 86.9 | 99.15 | 0.87 | 82.29 | 98.81 | 88.87 | 97.09 | 0.84 | 82.08 | 97.74 | 80.35 | 96.16 | 0.79 |
EC1.13 Oxidoreductases acting on single donors with incorporation of molecular oxygen (oxygenases) |
GO:0016701 | 55.77 | 99.74 | 69.05 | 99.29 | 0.62 | - | - | - | - | - | 79.44 | 99.04 | 82.8 | 97.96 | 0.80 |
EC1.14 Oxidoreductases acting on paired donors with incorporation reduction of molecular oxygen |
GO:0016705 | 70.99 | 98.86 | 62 | 98.15 | 0.66 | 73.51 | 99.24 | 92.54 | 96.32 | 0.81 | 76.74 | 95.45 | 69.16 | 93.26 | 0.69 |
EC1.15 Oxidoreductases acting on superoxide as acceptor |
GO:0016721 | 92.5 | 99.6 | 91.74 | 99.28 | 0.92 | 94.03 | 99.76 | 97.05 | 99.31 | 0.95 | 92.63 | 99.57 | 94.49 | 99.06 | 0.93 |
EC1.17 Oxidoreductases acting on CH2 groups |
GO:0016725 | 78.18 | 99.82 | 82.69 | 99.59 | 0.80 | 82.3 | 99.16 | 95.32 | 96.26 | 0.87 | - | - | - | - | - |
EC1.18 Oxidoreductases acting on iron-sulfur proteins as donors |
GO:0016730 | 91.76 | 99.56 | 78 | 99.43 | 0.84 | 87.74 | 99.62 | 92.35 | 99.02 | 0.89 | 83.69 | 99.15 | 83.52 | 98.39 | 0.82 |
EC2.1 Transferases transferring one-carbon groups |
GO:0016741 | 68.1 | 85 | 20.43 | 84.1 | 0.32 | - | - | - | - | - | - | - | - | - | - |
EC2.2 Transferases transferring aldehyde or ketone residues |
GO:0016744 | 83.87 | 99.7 | 89.66 | 99.23 | 0.87 | - | - | - | - | - | - | - | - | - | - |
EC2.3 Acyltransferases |
GO:0016764 | 81.67 | 97.28 | 87.89 | 94.24 | 0.81 | - | - | - | - | - | - | - | - | - | - |
EC2.4 Glycosyltransferases |
GO:0042123 | 70.49 | 94.19 | 41.51 | 92.88 | 0.51 | - | - | - | - | - | - | - | - | - | - |
EC2.5 Transferases transferring alkyl or aryl groups, other than methyl groups |
GO:0016765 | 70.26 | 98.14 | 59.57 | 97.1 | 0.63 | - | - | - | - | - | - | - | - | - | - |
EC2.6 Transferases transferring nitrogenous groups |
GO:0016769 | 70.09 | 99.03 | 60.48 | 98.42 | 0.64 | - | - | - | - | - | - | - | - | - | - |
EC2.7 Transferases transferring phosphorus-containing groups |
GO:0016772 | 81.66 | 89.05 | 79.76 | 86.5 | 0.70 | - | - | - | - | - | - | - | - | - | - |
EC2.8 Transferases transferring sulfur-containing groups |
GO:0016782 | 66.67 | 99.78 | 64.52 | 99.59 | 0.66 | 89.29 | 98.79 | 94.85 | 96.89 | 0.90 | 92.51 | 94.34 | 79.54 | 93.99 | 0.82 |
EC2.9 Transferring selenium-containing groups |
GO:0016785 | 95.95 | 99.99 | 99.33 | 99.92 | 0.97 | 92.38 | 99.88 | 92.53 | 99.75 | 0.92 | 83.72 | 99.69 | 81.43 | 99.44 | 0.82 |
EC3.1 Hydrolases acting on ester bonds |
GO:0016788 | 71.11 | 90.6 | 45.61 | 88.65 | 0.51 | - | - | - | - | - | - | - | - | - | - |
EC3.2 Glycosylases |
GO:0016798 | 84.54 | 94.85 | 84.01 | 92.35 | 0.79 | - | - | - | - | - | - | - | - | - | - |
EC3.3 Hydrolases acting on ether bonds |
GO:0016801 | 59.26 | 99.36 | 50 | 98.94 | 0.54 | 85.23 | 99.9 | 97.18 | 99.32 | 0.91 | 83.98 | 99.39 | 84.26 | 98.81 | 0.84 |
EC3.4 Hydrolases acting on peptide bonds (Peptidases) |
GO:0008233 | 74.58 | 94.2 | 48.62 | 92.85 | 0.57 | - | - | - | - | - | - | - | - | - | - |
EC3.5 Hydrolases acting on carbon-nitrogen bonds, other than peptide bonds |
GO:0016810 | 60.47 | 97.78 | 54.17 | 96.23 | 0.56 | - | - | - | - | - | - | - | - | - | - |
EC3.6 Hydrolases acting on acid anhydrides |
GO:0016817 | 91.6 | 95.57 | 75.74 | 95.05 | 0.81 | - | - | - | - | - | - | - | - | - | - |
EC3.7 Acting on carbon-carbon bonds |
GO:0016822 | 96.48 | 99.89 | 94.56 | 99.82 | 0.95 | 91.19 | 99.91 | 95.19 | 99.74 | 0.93 | 84.4 | 99.43 | 78.03 | 99.07 | 0.81 |
EC3.8 Acting on halide bonds |
GO:0016824 | 89.45 | 99.9 | 82.79 | 99.84 | 0.86 | 74.37 | 99.94 | 87.57 | 99.81 | 0.81 | 51.06 | 99.84 | 77.5 | 99.32 | 0.62 |
EC4.1 Carbon-carbon lyases |
GO:0016830 | 89.82 | 89.35 | 83.9 | 89.53 | 0.78 | - | - | - | - | - | - | - | - | - | - |
EC4.2 Carbon-oxygen lyases |
GO:0016835 | 80.4 | 92.24 | 80.8 | 88.82 | 0.73 | - | - | - | - | - | - | - | - | - | - |
EC4.3 Carbon-nitrogen lyases |
GO:0016840 | 74.36 | 99.26 | 43.94 | 99.07 | 0.57 | 85.13 | 98.84 | 82.59 | 98 | 0.83 | 83.04 | 98.19 | 74.05 | 97.31 | 0.77 |
EC4.4 Carbon-sulfur lyases |
GO:0016846 | 60.34 | 99.86 | 83.33 | 99.41 | 0.71 | 83.78 | 99.18 | 86.84 | 98.25 | 0.84 | 76.99 | 98.99 | 82.65 | 97.69 | 0.79 |
EC4.6 Phosphorus-oxygen lyases |
GO:0016849 | 67.07 | 82.06 | 5.77 | 81.82 | 0.17 | 60.49 | 98.8 | 73.85 | 96.77 | 0.65 | 72.73 | 98.04 | 66.78 | 96.74 | 0.68 |
EC5.1 Racemases and Epimerases |
GO:0016854 | 53.03 | 99.4 | 53.85 | 98.8 | 0.53 | 69.26 | 98.7 | 94.49 | 91.54 | 0.76 | 80.66 | 93.81 | 79.95 | 90.73 | 0.74 |
EC5.2 Cis-trans-Isomerases |
GO:0016859 | 66.67 | 99.52 | 75 | 98.83 | 0.70 | 88.36 | 98.66 | 93.51 | 96.82 | 0.89 | 89.89 | 97.23 | 86.98 | 95.98 | 0.86 |
EC5.3 Intramolecular oxidoreductases |
GO:0016860 | 75.84 | 98.02 | 57.69 | 97.26 | 0.65 | - | - | - | - | - | - | - | - | - | - |
EC5.4 Intramolecular transferases |
GO:0016866 | 54.55 | 99.38 | 57.53 | 98.71 | 0.56 | - | - | - | - | - | - | - | - | - | - |
EC5.5 Intramolecular lyases |
GO:0016872 | 70.09 | 99.03 | 60.48 | 98.42 | 0.64 | 75.39 | 99.86 | 82.59 | 99.65 | 0.79 | 62.36 | 99.83 | 76.69 | 99.48 | 0.69 |
EC5.99 Other Isomerases |
GO:0016853 | 92.17 | 99.56 | 87.43 | 99.33 | 0.89 | 94.49 | 99.62 | 98.34 | 98.63 | 0.95 | 96.64 | 94.76 | 80.52 | 95.1 | 0.85 |
EC6.1 Ligases forming carbon-oxygen bonds |
GO:0016875 | 90.79 | 97.32 | 91.37 | 95.76 | 0.88 | - | - | - | - | - | - | - | - | - | - |
EC6.2 Ligases forming carbon-sulfur bonds |
GO:0016877 | 79.69 | 99.75 | 79.69 | 99.51 | 0.79 | 89.5 | 98.88 | 92.33 | 97.66 | 0.89 | 91.99 | 95.67 | 75.63 | 95.21 | 0.81 |
EC6.3 Ligases forming carbon-nitrogen bonds |
GO:0016879 | 83.76 | 95.46 | 86.73 | 92.4 | 0.80 | - | - | - | - | - | - | - | - | - | - |
EC6.4 Ligases forming carbon-carbon bonds |
GO:0016885 | 63.64 | 99.92 | 87.5 | 99.61 | 0.74 | 86.73 | 98.94 | 89.43 | 97.79 | 0.87 | 94.83 | 96.44 | 72.6 | 96.29 | 0.81 |
EC6.5 Ligases forming phosphoric ester bonds |
GO:0016886 | 70.97 | 99.88 | 78.57 | 99.7 | 0.75 | 88.46 | 99.77 | 96.94 | 98.9 | 0.92 | 91.96 | 96.31 | 66.27 | 95.99 | 0.76 |
EC6.6 Forming nitrogen�metal bonds |
GO:0051002 | 89.29 | 99.93 | 91.74 | 99.83 | 0.91 | 79.46 | 99.95 | 94.01 | 99.77 | 0.87 | 88.43 | 98.71 | 55.73 | 98.53 | 0.69 |
TC1.A alpha-type channels |
GO:0005216 | 86.77 | 99.28 | 78.85 | 98.9 | 0.82 | - | - | - | - | - | - | - | - | - | - |
TC1.B beta-barrel porins |
GO:0015288 | 70.65 | 99.6 | 69.15 | 99.23 | 0.69 | - | - | - | - | - | - | - | - | - | - |
TC1.C Pore-forming toxins (proteins and peptides) |
GO:0005216 | 78.74 | 99.77 | 86.96 | 99.36 | 0.82 | - | - | - | - | - | - | - | - | - | - |
TC1.E Holins |
GO:0034290 | 78.57 | 99.94 | 93.22 | 99.69 | 0.85 | - | - | - | - | - | - | - | - | - | - |
TC2.A porters (symporters, uniporters, antiporters) |
GO:0015291 | 87.26 | 98.51 | 80.43 | 97.77 | 0.82 | - | - | - | - | - | - | - | - | - | - |
TC2.A.1 Major facilitator family (MFS) |
GO:0005215 | 76.54 | 97.86 | 28.7 | 97.62 | 0.46 | - | - | - | - | - | - | - | - | - | - |
TC2.A.3 Amino acid-polyamine-organocation (APC) family |
GO:0005215 | 93.94 | 99.36 | 40.26 | 99.34 | 0.62 | - | - | - | - | - | - | - | - | - | - |
TC2.A.6 Resistance-nodulation-cell division (RND) family |
GO:0005215 | 71.88 | 99.41 | 34.85 | 99.28 | 0.50 | - | - | - | - | - | - | - | - | - | - |
TC2.C Ion-gradient-driven energizers |
GO:0015291 | 76.47 | 99.79 | 87.5 | 99.35 | 0.81 | - | - | - | - | - | - | - | - | - | - |
TC3.A P-P-bond-hydrolysis-driven transporters |
GO:0015405 | 78.68 | 97.63 | 86.25 | 94.62 | 0.79 | - | - | - | - | - | - | - | - | - | - |
TC3.A.1 ATP-binding cassette (ABC) family |
GO:0043190 | 94.1 | 91.55 | 36.41 | 91.68 | 0.56 | - | - | - | - | - | - | - | - | - | - |
TC3.A.3 P-type ATPase (P-ATPase) family |
GO:0015662 | 97.06 | 95.68 | 17.37 | 95.69 | 0.40 | - | - | - | - | - | - | - | - | - | - |
TC3.A.5 Type II (general) secretory pathway (IISP) family |
GO:0015405 | 85.94 | 91.54 | 15.17 | 91.44 | 0.35 | - | - | - | - | - | - | - | - | - | - |
TC3.A.15 The Outer Membrane Protein Secreting Main Terminal Branch (MTB) family |
GO:0015405 | 60.61 | 98.05 | 12.35 | 97.88 | 0.26 | - | - | - | - | - | - | - | - | - | - |
TC3.D Oxidoreduction-driven transporters |
GO:0015453 | 91.14 | 99.5 | 94.49 | 98.79 | 0.92 | - | - | - | - | - | - | - | - | - | - |
TC3.E Light absorption-driven transporters |
GO:0015454 | 96.11 | 99.85 | 97.29 | 99.65 | 0.96 | - | - | - | - | - | - | - | - | - | - |
TC4.A Phosphotransfer-driven group translocators |
GO:0008982 | 82.7 | 99.66 | 87.93 | 99.16 | 0.85 | - | - | - | - | - | - | - | - | - | - |
TC9.A Recognized transporters of unknown biochemical mechanism |
GO:0005215 | 78.79 | 99.3 | 75.14 | 98.76 | 0.76 | - | - | - | - | - | - | - | - | - | - |
TC9.B Putative uncharacterized transport proteins |
GO:0005215 | 80.17 | 98.39 | 82.72 | 96.8 | 0.79 | - | - | - | - | - | - | - | - | - | - |
7 transmembrane receptor (rhodopsin family and chemoreceptor) |
GO:0004930 | 96.9 | 99.16 | 97.33 | 98.62 | 0.96 | - | - | - | - | - | - | - | - | - | - |
7 transmembrane receptor (secretin family) |
GO:0004930 | 90.7 | 94.91 | 24.02 | 94.84 | 0.45 | - | - | - | - | - | - | - | - | - | - |
7 transmembrane receptor (metabotropic glutamate family) |
GO:0004930 | 89.86 | 95.77 | 16.76 | 95.72 | 0.37 | - | - | - | - | - | - | - | - | - | - |
7 transmembrane receptor (odorant receptor) |
GO:0004930 | 97.44 | 97.56 | 17.59 | 97.56 | 0.41 | - | - | - | - | - | - | - | - | - | - |
G protein coupled receptors |
GO:0004930 | 95.62 | 98.07 | 94.53 | 97.43 | 0.93 | 94.05 | 99.9 | 93.38 | 99.81 | 0.94 | 96.63 | 98.94 | 64.11 | 98.9 | 0.78 |
Nuclear receptors |
GO:0003700 | 89.47 | 97.57 | 90.2 | 95.94 | 0.87 | - | - | - | - | - | - | - | - | - | - |
DNA-binding proteins |
GO:0003677 | 90.4 | 85.56 | 77.77 | 87.29 | 0.74 | 68.97 | 98.06 | 85.19 | 94 | 0.73 | 81.86 | 90.19 | 61.38 | 88.85 | 0.65 |
RNA-binding proteins |
GO:0003723 | 97.76 | 95.98 | 69.04 | 96.13 | 0.81 | - | - | - | - | - | - | - | - | - | - |
mRNA-binding proteins |
GO:0003729 | 79.27 | 96.48 | 37.9 | 96.02 | 0.53 | - | - | - | - | - | - | - | - | - | - |
rRNA-binding proteins |
GO:0019843 | 94.06 | 98.68 | 59.01 | 98.59 | 0.74 | 95.84 | 98.68 | 93.56 | 98.2 | 0.94 | 96.49 | 98.29 | 91.42 | 98.01 | 0.93 |
tRNA-binding proteins |
GO:0000049 | 94.12 | 99.9 | 90.57 | 99.84 | 0.92 | - | - | - | - | - | - | - | - | - | - |
Structural proteins (Matrix protein,Core protein,Viral occlusion body,Keratin) |
GO:0005198 | 98.46 | 99.19 | 98.49 | 98.93 | 0.97 | - | - | - | - | - | - | - | - | - | - |
Lectin |
GO:0030246 | 81.63 | 85.7 | 5.31 | 85.66 | 0.17 | - | - | - | - | - | - | - | - | - | - |
Chlorophyll |
GO:0016168 | 97.35 | 99.84 | 97.91 | 99.67 | 0.97 | - | - | - | - | - | - | - | - | - | - |
Photoreceptor |
GO:0009881 | 92.88 | 99.62 | 95.47 | 99.09 | 0.94 | 80.77 | 99.98 | 91.3 | 99.94 | 0.86 | 61.17 | 99.78 | 41.72 | 99.68 | 0.50 |
DNA-directed DNA polymerase |
GO:0003887 | 81.93 | 98.65 | 88.45 | 96.78 | 0.83 | 80.2 | 99.67 | 66.39 | 99.51 | 0.73 | 51.06 | 99.39 | 41.18 | 98.99 | 0.46 |
DNA-directed RNA polymerase |
GO:0003899 | 88.95 | 97.95 | 93.48 | 95.72 | 0.88 | - | - | - | - | - | - | - | - | - | - |
Lipid-binding |
GO:0008289 | 84.43 | 99.87 | 93.38 | 99.54 | 0.88 | 66.92 | 99.72 | 72.1 | 99.37 | 0.69 | 72.82 | 99.63 | 71.23 | 99.3 | 0.71 |
All lipid-binding proteins |
GO:0008289 | 89.88 | 96.95 | 95.25 | 94.09 | 0.88 | - | - | - | - | - | - | - | - | - | - |
Calcium-binding |
GO:0005509 | 86.26 | 88.22 | 57.04 | 87.92 | 0.63 | - | - | - | - | - | - | - | - | - | - |
Cobalt-binding |
GO:0050897 | 81.63 | 99.91 | 98.09 | 98.93 | 0.89 | - | - | - | - | - | - | - | - | - | - |
Copper-binding |
GO:0005507 | 83.51 | 98.11 | 72.76 | 97.28 | 0.77 | - | - | - | - | - | - | - | - | - | - |
Iron-binding |
GO:0005506 | 93.96 | 91.37 | 64.86 | 91.74 | 0.73 | - | - | - | - | - | - | - | - | - | - |
Magnesium-binding |
GO:0000287 | 81.16 | 87.9 | 80.91 | 85.29 | 0.69 | - | - | - | - | - | - | - | - | - | - |
Manganese-binding |
GO:0030145 | 85.36 | 94.51 | 71.88 | 93.22 | 0.74 | - | - | - | - | - | - | - | - | - | - |
Nickel-binding |
GO:0016151 | 77.61 | 99.18 | 70.59 | 98.64 | 0.73 | - | - | - | - | - | - | - | - | - | - |
Potassium-binding |
GO:0030955 | 90.39 | 99.95 | 98.69 | 99.56 | 0.94 | - | - | - | - | - | - | - | - | - | - |
Sodium-binding |
GO:0031402 | 90.91 | 99.86 | 97.39 | 99.37 | 0.94 | - | - | - | - | - | - | - | - | - | - |
Zinc-binding |
GO:0008270 | 74.91 | 98.02 | 97.32 | 86.7 | 0.75 | - | - | - | - | - | - | - | - | - | - |
Metal-binding |
GO:0046872 | 78.07 | 88.01 | 95.14 | 80.55 | 0.59 | - | - | - | - | - | - | - | - | - | - |
Actin binding |
GO:0003779 | 94.94 | 99.45 | 83.25 | 99.33 | 0.88 | - | - | - | - | - | - | - | - | - | - |
Chitin-binding |
GO:0008061 | 92.42 | 99.9 | 84.78 | 99.86 | 0.88 | 75.36 | 99.91 | 82.81 | 99.77 | 0.79 | 93.63 | 98.6 | 29.86 | 98.57 | 0.53 |
Folate-binding |
GO:0005542 | 96.97 | 100 | 98.97 | 99.99 | 0.98 | 94.95 | 100 | 98.95 | 99.98 | 0.97 | 94.12 | 99.86 | 62.75 | 99.84 | 0.77 |
Antioxidant |
GO:0016209 | 89 | 99.97 | 89.9 | 99.94 | 0.89 | 86 | 99.94 | 78.9 | 99.9 | 0.82 | 69.05 | 99.92 | 73.73 | 99.82 | 0.71 |
Calmodulin-binding |
GO:0005516 | 87.2 | 99.96 | 90.51 | 99.9 | 0.89 | 82.93 | 99.93 | 83.95 | 99.85 | 0.83 | 69.96 | 99.44 | 41.6 | 99.27 | 0.54 |
Cyclin |
GO:0061575 | 97.96 | 99.98 | 88.89 | 99.98 | 0.93 | 89.8 | 99.94 | 66.67 | 99.93 | 0.77 | 74.74 | 99.84 | 52.21 | 99.78 | 0.62 |
Cyclosporin |
GO:0042277 | 87.5 | 100 | 100 | 99.99 | 0.93 | 75 | 99.99 | 80 | 99.98 | 0.77 | 84.21 | 99.93 | 35.56 | 99.92 | 0.55 |
Cytokine |
GO:0005125 | 91.29 | 99.93 | 89.8 | 99.88 | 0.91 | - | - | - | - | - | 70.66 | 99.85 | 80 | 99.61 | 0.75 |
Elongation factor |
GO:0003746 | 97.48 | 99.97 | 98.78 | 99.91 | 0.98 | 84.14 | 99.87 | 94.01 | 99.49 | 0.89 | 95.84 | 99.56 | 83.71 | 99.47 | 0.89 |
Excision nuclease |
GO:0004518 | 97.39 | 99.99 | 99 | 99.97 | 0.98 | 93.46 | 99.93 | 91.37 | 99.87 | 0.92 | 95.75 | 99.48 | 58.84 | 99.45 | 0.75 |
Eye lens protein |
GO:0005212 | 98 | 100 | 98 | 99.99 | 0.98 | 100 | 99.95 | 71.43 | 99.95 | 0.84 | 96.77 | 99.97 | 82.19 | 99.96 | 0.89 |
Growth factor |
GO:0008083 | 88.89 | 99.92 | 88.52 | 99.85 | 0.89 | 86.01 | 99.91 | 86.72 | 99.82 | 0.86 | 76.74 | 99.87 | 81.91 | 99.7 | 0.79 |
GTPase activation |
GO:0005096 | 92.92 | 99.94 | 83.33 | 99.92 | 0.88 | 86.73 | 99.93 | 78.4 | 99.89 | 0.82 | 61.84 | 99.56 | 42.24 | 99.36 | 0.51 |
Guanine-nucleotide releasing factor |
GO:0005085 | 83.33 | 99.95 | 77.38 | 99.91 | 0.80 | 89.74 | 99.85 | 55.56 | 99.83 | 0.71 | 93.79 | 99.18 | 31.72 | 99.15 | 0.54 |
Heparin-binding |
GO:0008201 | 89.13 | 99.92 | 73.87 | 99.89 | 0.81 | 90.22 | 99.86 | 61.03 | 99.83 | 0.74 | 70.73 | 99.93 | 75 | 99.84 | 0.73 |
Hormone |
GO:0005179 | 87.69 | 99.92 | 90.68 | 99.81 | 0.89 | 76.88 | 99.9 | 87.97 | 99.7 | 0.82 | 69.78 | 99.83 | 80.45 | 99.52 | 0.75 |
Initiation factor |
GO:0003743 | 91.36 | 99.86 | 93.02 | 99.7 | 0.92 | 74.21 | 99.93 | 95.41 | 99.43 | 0.84 | 77.63 | 99.65 | 81.18 | 99.22 | 0.79 |
Ion channel |
GO:0005216 | 90.58 | 99.82 | 87.77 | 99.68 | 0.89 | - | - | - | - | - | 75.77 | 99.03 | 57.46 | 98.63 | 0.66 |
Metalloenzyme inhibitor |
GO:0004857 | 83.33 | 99.99 | 93.75 | 99.98 | 0.88 | 88.89 | 99.98 | 80 | 99.97 | 0.84 | 70.73 | 99.96 | 63.04 | 99.93 | 0.67 |
Porin |
GO:0015288 | 93.9 | 99.99 | 93.9 | 99.97 | 0.94 | 87.8 | 99.98 | 88.89 | 99.95 | 0.88 | 79.81 | 99.95 | 82.18 | 99.9 | 0.81 |
Protease inhibitor |
GO:0030414 | 79.79 | 99.93 | 85.23 | 99.83 | 0.82 | 75.53 | 99.57 | 47.18 | 99.44 | 0.59 | 66.79 | 99.73 | 63.39 | 99.49 | 0.65 |
Protein phosphatase inhibitor |
GO:0004864 | 96 | 99.99 | 88.89 | 99.99 | 0.92 | - | - | - | - | - | 64.86 | 99.99 | 88.89 | 99.96 | 0.76 |
SH3-binding |
GO:0017124 | 94.12 | 99.99 | 95.52 | 99.98 | 0.95 | - | - | - | - | - | 58.16 | 99.92 | 65.52 | 99.82 | 0.62 |
Sigma factor |
GO:0016987 | 87.04 | 99.98 | 85.45 | 99.96 | 0.86 | 83.33 | 99.97 | 81.82 | 99.95 | 0.82 | 68.33 | 99.9 | 50.62 | 99.85 | 0.59 |
Storage protein |
GO:0045735 | 50 | 99.98 | 40 | 99.97 | 0.45 | - | - | - | - | - | 63.64 | 99.88 | 22.95 | 99.86 | 0.39 |
Vitamin C binding |
GO:0031418 | 91.89 | 100 | 100 | 99.99 | 0.96 | 97.3 | 99.89 | 47.37 | 99.89 | 0.68 | 81.63 | 99.94 | 61.54 | 99.91 | 0.71 |
Zinc-finger |
GO:0070742; GO:0071535 | 56.32 | 99.91 | 97.79 | 96.99 | 0.73 | 78.44 | 97.34 | 67.91 | 96.08 | 0.71 | 71.6 | 96.8 | 66.77 | 94.72 | 0.66 |
TC8.A Auxiliary transport proteins |
GO:0006810 | 74.25 | 99.76 | 89.21 | 99.08 | 0.81 | - | - | - | - | - | - | - | - | - | - |
Cell adhesion |
GO:0007155 | 85.93 | 99.11 | 84.06 | 98.43 | 0.84 | - | - | - | - | - | - | - | - | - | - |
Chlorophyll biosynthesis |
GO:0015995 | 86.44 | 88.8 | 16.45 | 88.74 | 0.35 | - | - | - | - | - | - | - | - | - | - |
Herbicide resistance |
GO:0009635 | 95.22 | 99.86 | 95.22 | 99.72 | 0.95 | 96.72 | 99.98 | 89.39 | 99.98 | 0.93 | 95.16 | 99.97 | 85.51 | 99.97 | 0.90 |
Photorespiration |
GO:0009853 | 99.7 | 99.66 | 99.44 | 99.67 | 0.99 | 95.15 | 99.96 | 92.45 | 99.93 | 0.94 | 96.35 | 99.92 | 86.83 | 99.9 | 0.92 |
Photosynthesis |
GO:0015979 | 93.3 | 98.06 | 82.28 | 97.64 | 0.87 | 81.62 | 99.64 | 87.88 | 99.09 | 0.84 | 86.21 | 99.36 | 81.3 | 98.94 | 0.83 |
Plant defense |
GO:0006952 | 88.65 | 99.13 | 82.81 | 98.66 | 0.85 | - | - | - | - | - | - | - | - | - | - |
DNA condensation |
GO:0030261 | 87.64 | 99.45 | 80.41 | 99.16 | 0.84 | 69.83 | 99.89 | 66.39 | 99.79 | 0.68 | 83.21 | 99.9 | 72.67 | 99.84 | 0.77 |
DNA integration |
GO:0015074 | 86.63 | 98.07 | 87.05 | 96.58 | 0.85 | 72.79 | 99.96 | 87.61 | 99.86 | 0.80 | 68.92 | 99.85 | 63.75 | 99.74 | 0.66 |
DNA recombination |
GO:0006310 | 85.74 | 97.38 | 92.05 | 94.34 | 0.85 | 77.59 | 98.92 | 76.95 | 97.96 | 0.76 | 67.46 | 99.25 | 80.3 | 97.87 | 0.73 |
DNA repair |
GO:0006281 | 88.66 | 96.81 | 85.92 | 95.34 | 0.84 | 64.32 | 99.3 | 90.43 | 96.05 | 0.74 | 67.58 | 96.81 | 67.98 | 94.14 | 0.65 |
DNA replication |
GO:0006260 | 85.6 | 96.64 | 76.77 | 95.37 | 0.79 | 76.78 | 98.9 | 77.64 | 97.85 | 0.76 | 59.69 | 98.5 | 66.57 | 96.65 | 0.62 |
Lipid degradation |
GO:0016042 | 78.9 | 99.94 | 97.4 | 99.31 | 0.87 | 75.08 | 99.93 | 89.56 | 99.73 | 0.82 | 64.75 | 99.77 | 72.04 | 99.44 | 0.68 |
Lipid metabolism |
GO:0006629 | 79.5 | 99.17 | 66.67 | 98.77 | 0.72 | 72.08 | 98.5 | 80.32 | 96.43 | 0.74 | 71.83 | 97.78 | 73.92 | 95.69 | 0.71 |
Lipid synthesis |
GO:0008610 | 82.22 | 99.61 | 95.07 | 98.14 | 0.87 | - | - | - | - | - | - | - | - | - | - |
Lipid transport |
GO:0006869 | 79.49 | 99.81 | 80.52 | 99.6 | 0.80 | 71.51 | 99.93 | 82.55 | 99.8 | 0.77 | 59.43 | 99.79 | 60.87 | 99.58 | 0.60 |
Lipopolysaccharide biosynthesis |
GO:0009103 | 76.64 | 99.83 | 88.98 | 99.43 | 0.82 | - | - | - | - | - | - | - | - | - | - |
Lipoprotein |
GO:0055097; GO:0055096 | 90.59 | 98.54 | 94.88 | 96.71 | 0.91 | - | - | - | - | - | - | - | - | - | - |
Immune response |
GO:0006955 | 86.84 | 99.95 | 97.06 | 99.7 | 0.92 | - | - | - | - | - | - | - | - | - | - |
Inflammatory response |
GO:0006954 | 87.5 | 99.75 | 73.68 | 99.65 | 0.80 | 75.37 | 99.69 | 46.98 | 99.6 | 0.59 | 55.21 | 99.81 | 59.22 | 99.6 | 0.57 |
Innate immunity |
GO:0045087 | 89.66 | 99.9 | 86.67 | 99.82 | 0.88 | 65.52 | 99.93 | 85.88 | 99.71 | 0.75 | 84.64 | 99.24 | 49.74 | 99.12 | 0.65 |
Virulent protein |
GO:0009405 | 95.38 | 99.92 | 96.49 | 99.82 | 0.96 | 70.3 | 99.92 | 87.65 | 99.66 | 0.78 | 63.98 | 99.14 | 49.15 | 98.69 | 0.56 |
mRNA capping |
GO:0006370 | 80.77 | 99.85 | 79.25 | 99.72 | 0.80 | 82.19 | 99.97 | 91.6 | 99.9 | 0.87 | 61.54 | 99.72 | 46.83 | 99.57 | 0.54 |
mRNA slicing |
- | 77.27 | 99.3 | 77.27 | 98.65 | 0.77 | - | - | - | - | - | - | - | - | - | - |
Actin capping |
GO:0051693 | 95.1 | 99.98 | 93.27 | 99.97 | 0.94 | 91.18 | 99.9 | 70.99 | 99.87 | 0.81 | 73.33 | 99.93 | 55 | 99.9 | 0.63 |
DNA replication inhibitor |
GO:0008156 | 97.93 | 99.99 | 97.93 | 99.97 | 0.98 | 97.11 | 99.94 | 91.09 | 99.92 | 0.94 | 93.93 | 99.89 | 83.75 | 99.85 | 0.89 |
Mitogen |
GO:0051781 | 92.74 | 99.93 | 93.24 | 99.86 | 0.93 | 83.6 | 99.92 | 91.2 | 99.75 | 0.87 | 85.19 | 99.77 | 79.59 | 99.62 | 0.82 |
Pathogenesis-related protein |
GO:0009607 | 96.33 | 99.98 | 98.01 | 99.94 | 0.97 | 94.87 | 99.93 | 94.17 | 99.88 | 0.94 | 91.26 | 99.91 | 91.67 | 99.81 | 0.91 |
Protein synthesis inhibitor |
GO:0017148 | 86.06 | 99.97 | 92.81 | 99.91 | 0.89 | 81.82 | 99.93 | 84.91 | 99.85 | 0.83 | 79.43 | 99.8 | 63.18 | 99.71 | 0.71 |
Vasoactive |
GO:0050880 | 94.96 | 99.99 | 97.41 | 99.98 | 0.96 | 93.28 | 99.95 | 86.05 | 99.93 | 0.89 | 86.23 | 99.96 | 88.15 | 99.91 | 0.87 |
Amphibian defense peptide |
GO:0006952 | 100 | 100 | 75 | 100 | 0.87 | 66.67 | 99.98 | 25 | 99.98 | 0.41 | 100 | 99.98 | 66.67 | 99.98 | 0.82 |
Chromatin regulator |
GO:0016568 | 76.43 | 99.5 | 62.86 | 99.24 | 0.69 | 68.24 | 99.65 | 68.41 | 99.3 | 0.68 | 59.9 | 98.99 | 47.73 | 98.4 | 0.53 |
Chromophore |
GO:0018298 | 93.83 | 99.93 | 93.83 | 99.87 | 0.94 | 86.91 | 99.87 | 88.44 | 99.73 | 0.88 | 89.38 | 99.49 | 68.2 | 99.37 | 0.77 |
Covalent protein-RNA linkage |
GO:0018144 | 96.3 | 99.96 | 80 | 99.96 | 0.88 | 90.74 | 99.99 | 92.45 | 99.98 | 0.92 | 74.55 | 99.79 | 32.54 | 99.75 | 0.49 |
Hypotensive agent |
GO:0008217 | 66.67 | 100 | 100 | 100 | 0.82 | 66.67 | 99.99 | 33.33 | 99.99 | 0.47 | 87.5 | 99.99 | 58.33 | 99.98 | 0.71 |
Integrin |
GO:0007229 | 90.91 | 100 | 95.24 | 99.99 | 0.93 | 86.36 | 99.93 | 41.3 | 99.92 | 0.60 | 90.32 | 99.92 | 47.46 | 99.91 | 0.66 |
Motor protein |
GO:0098840 | 89.47 | 99.97 | 91.07 | 99.94 | 0.90 | 80.7 | 99.95 | 82.88 | 99.89 | 0.82 | 64.32 | 99.46 | 39.03 | 99.27 | 0.50 |
Neuropeptide |
GO:0007218 | 86.21 | 99.93 | 66.67 | 99.91 | 0.75 | 79.31 | 99.96 | 76.67 | 99.93 | 0.78 | 79.75 | 99.89 | 60 | 99.85 | 0.69 |
Signal transduction inhibitor |
GO:0009968 | 84.62 | 99.91 | 49.25 | 99.89 | 0.65 | 84.62 | 99.98 | 80.49 | 99.96 | 0.82 | 87.04 | 99.94 | 65.28 | 99.92 | 0.75 |
Transmembrane |
GO:0016021 | 90.12 | 86.66 | 79.06 | 87.9 | 0.75 | - | - | - | - | - | - | - | - | - | - |
Outer membrane |
GO:0009279 | 92.71 | 86.42 | 32.12 | 86.83 | 0.50 | - | - | - | - | - | - | - | - | - | - |
Coat proteins |
GO:0030117 | 84.77 | 99.41 | 85.2 | 98.85 | 0.84 | - | - | - | - | - | - | - | - | - | - |
Envelope proteins |
GO:0019031 | 90 | 99.5 | 84.38 | 99.22 | 0.87 | - | - | - | - | - | - | - | - | - | - |
Photosystem I |
GO:0009522 | 97.6 | 84.76 | 23.5 | 85.35 | 0.44 | 88.37 | 99.94 | 87.36 | 99.89 | 0.88 | 86.8 | 99.9 | 81.82 | 99.84 | 0.84 |
Photosystem II |
GO:0009523 | 97.47 | 99.48 | 97.07 | 99.18 | 0.97 | - | - | - | - | - | - | - | - | - | - |
Collagen |
GO:0005581 | 96.83 | 99.99 | 96.83 | 99.99 | 0.97 | 96.83 | 99.94 | 74.39 | 99.94 | 0.85 | 84.47 | 99.98 | 92.55 | 99.94 | 0.88 |
Flavoprotein |
GO:0045251 | 87.93 | 99.36 | 88.02 | 98.78 | 0.87 | 73.73 | 99.54 | 89.55 | 98.24 | 0.81 | 71.3 | 97.81 | 64.25 | 96.43 | 0.66 |
Mutator protein |
GO:1990633 | 83.82 | 100 | 98.28 | 99.97 | 0.91 | 77.94 | 99.91 | 62.35 | 99.87 | 0.70 | 70 | 99.95 | 73.13 | 99.9 | 0.71 |
Viral nucleoprotein |
GO:0019013 | 89.91 | 99.95 | 91.93 | 99.89 | 0.91 | 87.72 | 99.98 | 96.15 | 99.9 | 0.92 | 79.06 | 99.87 | 77.73 | 99.74 | 0.78 |
cAMP binding |
- | 97.29 | 99.97 | 98.55 | 99.92 | 0.98 | - | - | - | - | - | 85.6 | 99.75 | 86.19 | 99.5 | 0.85 |
cGMP binding |
- | 98.46 | 100 | 98.46 | 99.99 | 0.98 | - | - | - | - | - | 82.19 | 99.79 | 41.96 | 99.76 | 0.58 |
Milk protein |
- | 92.16 | 100 | 97.92 | 99.99 | 0.95 | - | - | - | - | - | 74.07 | 99.98 | 86.96 | 99.95 | 0.80 |
Suppressor of RNA silencing |
- | 95.4 | 99.98 | 98.57 | 99.93 | 0.97 | 91.03 | 100 | 99.75 | 99.89 | 0.95 | 93.05 | 99.03 | 51.94 | 98.96 | 0.69 |
Allergen |
- | 85.19 | 99.88 | 60.53 | 99.84 | 0.71 | 86.42 | 99.92 | 69.31 | 99.89 | 0.77 | 74.11 | 99.95 | 79.81 | 99.87 | 0.77 |
Biotin binding |
- | 77.78 | 99.99 | 73.68 | 99.98 | 0.75 | - | - | - | - | - | 83.33 | 99.71 | 17.86 | 99.7 | 0.39 |
Cadmium binding |
- | 80 | 99.99 | 80 | 99.99 | 0.80 | - | - | - | - | - | 75 | 99.98 | 66.67 | 99.97 | 0.71 |
Chaperone |
- | 84.61 | 99.88 | 98.39 | 98.68 | 0.91 | 80.29 | 98.87 | 85.91 | 97.41 | 0.82 | 85.36 | 97.98 | 78.03 | 97 | 0.80 |
Chloride binding |
- | 92 | 99.98 | 92 | 99.96 | 0.92 | - | - | - | - | - | 71.64 | 99.85 | 62.34 | 99.76 | 0.66 |
Molybdenum binding |
- | 84.3 | 99.98 | 92.73 | 99.93 | 0.88 | - | - | - | - | - | 70.83 | 99.66 | 43.22 | 99.56 | 0.55 |
Muscle protein |
- | 95.38 | 99.96 | 90.51 | 99.95 | 0.93 | 89.23 | 99.91 | 77.33 | 99.87 | 0.83 | 79.77 | 99.89 | 76.67 | 99.81 | 0.78 |
Plastoquinone binding |
- | 96.7 | 99.98 | 98.65 | 99.94 | 0.97 | - | - | - | - | - | 93.46 | 99.76 | 82.03 | 99.69 | 0.87 |
Schiff base binding |
- | 93.2 | 99.86 | 93.56 | 99.73 | 0.93 | - | - | - | - | - | 73.3 | 99.7 | 83.4 | 99.17 | 0.77 |
Selenium binding |
- | 91.84 | 99.99 | 96.77 | 99.97 | 0.94 | - | - | - | - | - | 74 | 99.95 | 78.72 | 99.88 | 0.76 |
Sialic acid binding |
- | 76.19 | 100 | 94.12 | 99.98 | 0.85 | 90.48 | 99.9 | 35.19 | 99.9 | 0.57 | 81.82 | 99.96 | 64.29 | 99.95 | 0.73 |
Thiamine pyrophosphate binding |
- | 96.53 | 99.94 | 93.58 | 99.91 | 0.95 | 87.7 | 99.85 | 83.73 | 99.75 | 0.85 | 74.64 | 99.44 | 53.85 | 99.22 | 0.63 |
Ubiquinone binding |
- | 94.07 | 99.93 | 97.41 | 99.76 | 0.95 | 82.58 | 99.67 | 88.13 | 99.19 | 0.85 | 91.5 | 99.32 | 79.16 | 99.1 | 0.85 |
Last update: 29 Nov 2017 |
||||||||||||||||